
Watch the video
This player shows only the Bitcoin chapter of the daily altii market briefing. Watch the full video on tube.altii.de.
Key Data Snapshot
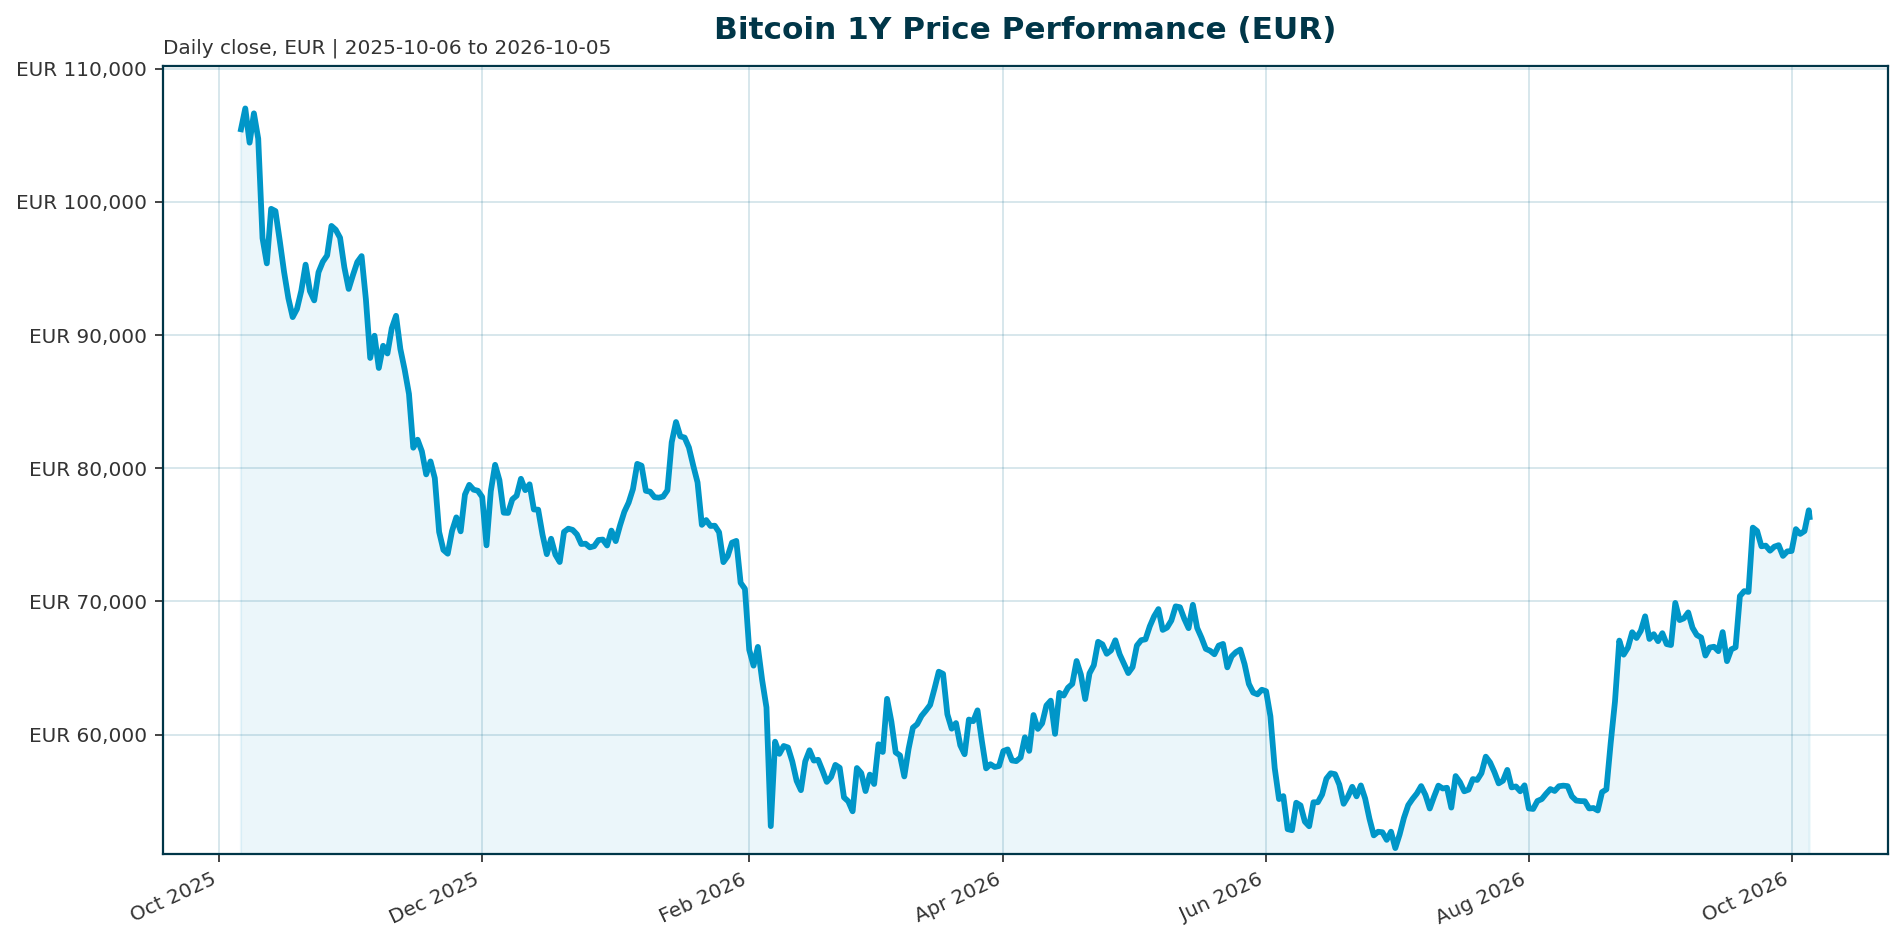
Bitcoin (BTC) trades at EUR 76,956 as of 2026-10-05 04:15 UTC. The asset ranks first by market capitalisation at EUR 1.546 trillion and dominates 59.28% of the total crypto market (EUR 2.606 trillion). Momentum is constructive on shorter horizons but negative over one year.
| Metric | Value |
|---|---|
| Price (EUR) | 76,956 |
| 24h change | +2.16% |
| 7d / 14d change | +3.23% / +5.91% |
| 30d / 200d change | +8.20% / +21.14% |
| 1y change | -30.61% |
| 1h change | -0.53% |
| 24h range | EUR 75,911 to 77,833 (width +2.53%) |
| All-time high | EUR 107,662 (2025-10-06), current price -28.52% below |
| Market cap / FDV | EUR 1.546tn / EUR 1.546tn, rank 1 |
| 24h volume | EUR 18.57bn (~35.8% of total crypto volume of EUR 51.83bn; 18.57/51.83) |
| Circulating supply | 20,093,512 of 21,000,000 max (95.7% issued; 20,093,512/21,000,000) |
| BTC dominance | 59.28% |
| Required upside to ATH | +39.8% (107,662/76,956 – 1) |
Note: the 24h market cap change of +1.38% (EUR +21.06bn) lags the +2.16% price change, a timing or supply-circulation artefact in the source data.
Market Setup
The cross-asset backdrop is neutral. Risk sentiment reads neutral and equity momentum is mixed: the Nikkei 225 leads on both a 5-day (+6.50%) and 1-month (+7.25%) basis, while the ATX is the weakest 5-day performer at -4.19%. DACH indicators average -2.38% over 5 days versus +1.35% for global equity indicators, so European allocators face a locally lagging equity market. The rates backdrop shows euro yields mixed with curve steepening: the euro-area AAA 10Y yield stands at 3.59% (down 2.3bp over 5 days but up 23.7bp over 1 month and +64.4bp YTD), the 2Y at 3.11% (-14.5bp over 5 days, front-end relief), with the 10Y-2Y spread at 48.6bp. FX is mixed: EUR/USD at 1.1285 (-0.38% over 5 days, -3.96% YTD), EUR/JPY at 178.18, EUR/GBP at 0.8525. For European investors, a firmer euro partially flatters EUR-quoted BTC returns relative to USD quotes; the -30.61% one-year EUR return embeds some of this FX effect.
On the policy side, the Federal Reserve under Chair Kevin Warsh is expected to hold rates through Q3, leaving limited room for the easing that has historically supported risk-asset recoveries [T2]. This caps the macro tailwind available to a high-beta asset like BTC and keeps the burden of proof on flows and regulation rather than liquidity.
Investment Thesis
Bitcoin now prices through ETF flow direction more than through any other variable. ETF flows effectively became Bitcoin’s new macro indicator in 2025: record Q4 outflows from US-listed BTC and ETH ETFs coincided with the break of USD 98,000 support and a retest of the low USD 90,000 range [T1]. Glassnode counts 6.7 million BTC across ETFs, exchanges and treasuries, roughly 33% of circulating supply (6.7m/20.09m), and labels the regime an “institutional supply era” [T1]. Reported volatility has fallen from 84% to 43%, shifting BTC toward a more allocatable, institutional profile [T1].
The 2026 flow record is two-sided. May brought USD 467m of single-day net inflows, the fourth consecutive positive day [T4]; June then produced a record outflow streak crossing USD 2bn that pushed BTC toward a key psychological zone [T6]. By August, inflows had resumed with breadth across pension funds, endowments, and corporate treasuries, though BlackRock’s IBIT captured roughly 70% of the total [T8]. The correlation between flows and spot price has strengthened considerably, with inflows typically preceding price appreciation by 24 to 48 hours [T3].
The core thesis: BTC sits mid-cycle in a post-ATH repair phase. Structural adoption keeps building even as near-term price action stays under pressure [T2]. With 95.7% of supply already issued, marginal price is set almost entirely by demand flows. The base case is consolidation in the mid-EUR 70,000s while flows stabilise; the bull case requires a renewed sustained inflow streak plus regulatory progress; the bear case is triggered by a repeat of the June outflow pattern against sticky rates near 3.6%.
Bullish Drivers
Demand-side and structural catalysts are tangible, though each carries conditions.
- ETF institutional breadth: Buyer diversity has widened from corporate treasuries seeking inflation hedges to family offices and conservative pension funds making first allocations, evidence BTC has crossed into institutional-grade portfolio construction [T8]. BlackRock’s USD 284m single-day IBIT inflow and Morgan Stanley’s market entry signal permanent integration [T3].
- Mechanical structural demand: ETF issuers must acquire physical Bitcoin to back created shares, a persistent source of price-insensitive buying [T7].
- Market-structure innovation: The planned CME Bitcoin VIX would let institutions isolate and price volatility separately for the first time, pending final CFTC approval [T5].
- Regulatory clarity: The US CLARITY Act would establish a federal market-structure framework and potentially unlock broader institutional participation if passed [T2]. Hong Kong’s Stablecoins Ordinance and Asia’s shift from pilots to targeted deployment broaden the global regulatory base [T2].
- Reduced volatility: The reported decline from 84% to 43% volatility supports larger institutional risk budgets [T1], and May’s technical reclaim of USD 80,000 opened the USD 85,000 to 90,000 resistance zone as the next objective [T4].
Bearish counterweight: institutional participation amplifies volatility as readily as it supports rallies, as the June record outflow streak demonstrated [T6][T7]. Catalysts remain contingent. CLARITY is not passed, the Bitcoin VIX awaits approval, and none of these drivers is yet realised in price.
Relative Positioning vs Gold and Ethereum
Against gold, BTC underperformed in the 2025 correction, lagging traditional assets including gold and bonds while falling nearly 30% from peak [T1]. That confirmed BTC’s high-beta character even in the institutional era. The portfolio-role distinction stands: gold retains the lower-volatility safe-haven mandate during rate uncertainty, while BTC offers higher expected growth with materially higher drawdown risk. In a hawkish or stagflationary regime gold outcompetes BTC for the same defensive capital; if rates ease, BTC’s growth profile can capture disproportionate flows. Precise gold price data in EUR is unavailable in this dataset, so the comparison remains qualitative.
Against Ethereum, BTC holds the structural lead. Dominance of 59.28% of a EUR 2.606tn market makes BTC the gravitational centre of the asset class, and institutional adoption depth favours BTC in North America and Europe. ETH ETFs shared the Q4 2025 record outflows alongside BTC products [T1]. One nuance: Asian institutional adoption favours tokenization and regulated stablecoins over pure bitcoin ETF plays, which dilutes BTC’s relative institutional priority in that region [T2]. Precise ETH performance data in EUR is unavailable in this dataset; comparisons here rely on the qualitative record. Note also that the EUR-quoted 1y return of -30.61% partially reflects EUR/USD weakness of -3.96% YTD; USD-denominated comparisons would differ.
Scenario Framework
The primary state variable is net ETF flow direction; secondary anchors are technical levels and the policy calendar. Probabilities below are analyst assumptions, not model outputs.
- Bull (~25-30%): A sustained multi-week ETF inflow streak resumes at May-style intensity (USD 400m+/day) [T4] while a regulatory catalyst lands, either CLARITY progress or Bitcoin VIX approval [T2][T5]. Price reclaims the USD 85,000-90,000 zone (approximately EUR 75,300-79,800 at EUR/USD 1.1285) and targets the EUR 107,662 ATH region. Trigger to watch: four or more consecutive positive-flow days.
- Base (~45-50%): Two-sided flows, the Fed on hold through Q3 [T2], and no discrete catalyst. BTC oscillates between roughly EUR 70,000 and 80,000 while structural adoption grinds on. The tight 24h range of +2.53% width is consistent with this consolidation.
- Bear (~20-25%): A renewed record outflow streak amid macro deterioration repeats the June pattern (USD 2bn+ leaving ETFs) [T6]. The USD 80,000 support (approximately EUR 70,900 at 1.1285) fails and price re-tests lower zones. The historical Q4 2025 breakdown near USD 98,000 to the low USD 90,000s [T1] maps to roughly EUR 86,900-79,800, now historical reference zones rather than live levels, given BTC has since moved well below them.
USD-to-EUR conversions are indicative at EUR/USD 1.1285 and sensitive to FX moves. The most recent ETF flow datapoint available is August 2026 [T8]; the current flow regime at report time is a data gap and should be verified before acting on any scenario.
Valuation Discussion
Traditional DCF does not apply to BTC; valuation rests on scarcity mechanics and flow elasticity. Market cap and fully diluted valuation are both EUR 1.546tn because only approximately 906,488 BTC (4.3% of the 21m cap) remain unissued. Scarcity is effectively fully embedded in the circulating float, so dilution risk is negligible and price discovery is entirely demand-side.
Float dynamics dominate. With 6.7m BTC (about 33% of circulating supply) held across ETFs, exchanges and treasuries [T1], the investable float is structurally compressed. Bull-case re-rating follows mechanically: rising institutional share of supply compresses float further and pushes price toward the ATH. Bear-case logic is symmetrical: if ETF outflows unwind structured holdings, effective float expands and the scarcity premium compresses faster than residual demand absorbs it.
The volatility repricing also matters for valuation. A fall from 84% to 43% volatility [T1] lowers the risk premium investors should demand, supporting higher allocations at the same price. At EUR 1.546tn, BTC’s market cap is comparable to a top-tier global mega-cap, and 59.28% dominance anchors the crypto risk-premium hierarchy. A reasonable base-case fair-value band sits at the current flow-adjusted consolidation in the mid-EUR 70,000s; re-rating requires a flow inflection, not a valuation argument. Bearish discipline: flow-based pricing is regime-dependent and offers no anchor if the institutional bid exits.
Risks
- Flow reversal: The June record outflow streak (USD 2bn+) proved institutional participation amplifies volatility as easily as it supports rallies [T6][T7]. Flow direction can turn faster than fundamentals change.
- Single-provider concentration: IBIT captures roughly 70% of recent inflows [T8], creating a single point of failure. An operational or confidence event at the dominant provider would transmit directly to BTC liquidity.
- Treasury buyer fatigue: Strategy (formerly MicroStrategy) has temporarily slowed purchases amid weaker financing conditions and falling ETF demand [T7], removing a previously reliable marginal buyer.
- Rates persistence: A Fed hold through Q3 under Chair Warsh [T2] and euro AAA 10Y yields near 3.59% keep the opportunity cost of holding a non-yielding asset elevated.
- Regulatory delay: The CLARITY Act is not passed and the CME Bitcoin VIX awaits final CFTC approval [T2][T5]. Institutional hedging tools remain incomplete until then.
- Competition for capital: BTC must compete with AI and other high-growth themes for allocators’ risk budgets [T6].
- Structural volatility: Frequent double-digit moves driven by ETF flows, macro data, or regulatory headlines persist [T5]. The unresolved question is whether institutions can actively control BTC risk during the next major stress event.
- Regional relevance: Asian adoption favours tokenization and stablecoins over pure bitcoin ETF exposure [T2], capping one institutional growth channel.
Appendix
Methodology notes. Market data retrieved 2026-10-05T04:15Z from CoinGecko (EUR quote). Market overview data as of 2026-10-02 to 2026-10-05 from the listed providers. USD technical levels converted at EUR/USD 1.1285: USD 80,000 ≈ EUR 70,900; USD 85,000 ≈ EUR 75,300; USD 90,000 ≈ EUR 79,800; USD 98,000 ≈ EUR 86,900. These conversions are indicative and FX-sensitive. Calculations shown: supply issued 20,093,512/21,000,000 = 95.7%; institutional custody share 6.7m/20.09m ≈ 33.3%; volume share 18.57bn/51.83bn ≈ 35.8%; upside to ATH 107,662/76,956 – 1 = +39.8%; 24h range width (77,833-75,911)/75,911 = +2.53%.
Data limitations. No current gold or Ethereum price data in EUR is available in this dataset; relative comparisons are qualitative. ETF flow figures are USD-denominated. All Tavily news items lack reliable publication dates; chronology is inferred from content. Volatility figures (84% to 43%) are as reported by the Glassnode x Fasanara 2025 report and not independently verified. Scenario probabilities are analyst assumptions. October 2026 ETF flow data is unavailable; the live flow regime is unknown at publication.
Sources
- [T1] Crypto Market 2025: Year-End Review & Expert Insights. tradingview.com
- [T2] Q2 2026 Digital Asset Review. coindesk.com
- [T3] Bitcoin Price Analysis April 2026. intellectia.ai
- [T4] Bitcoin Price Analysis May 2026. intellectia.ai
- [T5] CME Is Launching a Bitcoin VIX: Here’s Why That Changes Wall Street’s Bitcoin Game. 247wallst.com
- [T6] Bitcoin Opens June Under Pressure as ETF Outflows Cross $2B. hedgeco.net
- [T7] Bitcoin Outlook: ETF Outflows, Institutional Adoption & Price Forecast 2026. ig.com
- [T8] Bitcoin ETF Inflows Analysis August 2026. intellectia.ai
Disclaimer. This report is AI-generated and for informational purposes only. It does not constitute investment advice, a recommendation, or an offer to buy or sell any financial instrument. Data may be incomplete or stale; verify all figures independently before making any investment decision.
Important Note / Wichtiger Hinweis:
EN: This report may have been generated using AI. It processes data from publicly available sources. The content is provided for informational purposes only.DE: Dieser Bericht kann mithilfe von KI erstellt worden sein. Dabei werden Daten aus öffentlich zugänglichen Quellen verarbeitet. Die Inhalte dienen ausschließlich Informationszwecken.
* DE: Die ergänzenden Inhalte können KI-generiert sein. EN: The additional content may be AI-generated.