
Watch the video
This player shows only the Bitcoin chapter of the daily altii market briefing. Watch the full video on tube.altii.de.
Key Data Snapshot
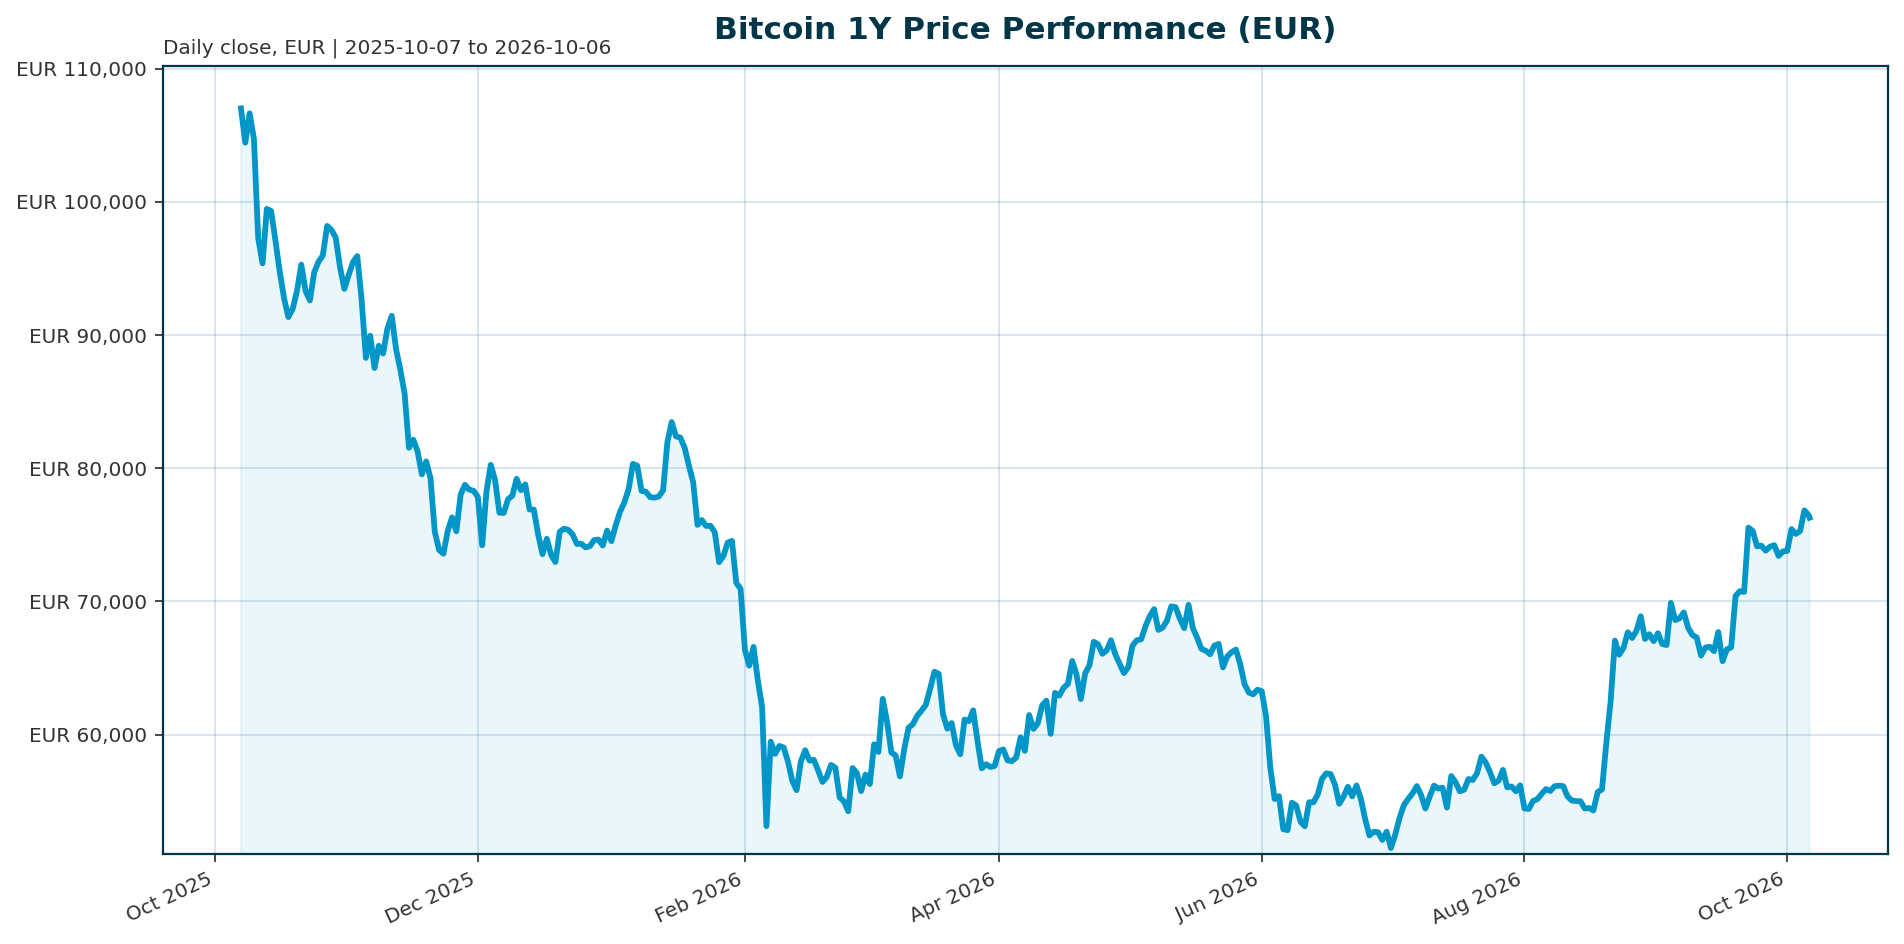
| Metric | Value | Note |
|---|---|---|
| Price (EUR) | €76,287 | -0.87% 24h, -0.01% 1h |
| 24h range | €75,765 to €77,238 | €1,473 range, ~1.93% of spot |
| Performance 7d / 30d | +3.07% / +6.99% | +21.37% over 200d |
| Performance 1y | -31.09% | Ath dated exactly one year ago |
| Market cap | €1.533 trillion | Rank 1; FDV €1.533 trillion |
| 24h volume | €25.96 billion | ~1.69% of market cap |
| Circulating supply | 20,093,996 BTC | 95.69% of the 21m cap |
| Remaining issuance | 906,004 BTC | 4.31% of max supply |
| All-time high | €107,662 (2025-10-06) | Current discount: -29.14% |
| BTC dominance | 58.70% | Total crypto cap €2.605 trillion |
Data as of 2026-10-06 (market data retrieved 04:15 UTC). Supply maths: 20,093,996 divided by 21,000,000 equals 95.69% issued; 21,000,000 minus 20,093,996 leaves 906,004 BTC. The market-cap-to-FDV gap is only €672,913, confirming minimal dilution from future issuance.
Market Setup
The broader market backdrop is neutral in risk sentiment, with mixed equity momentum and DACH equities lagging global peers: DACH indicators average -1.64% over five days against +1.97% for global equity indicators, and the ATX is the weakest five-day performer at -2.72% while the Nikkei 225 leads at +5.31%. This backdrop matters less for Bitcoin than the rates and liquidity channel, but it sets a cautious rather than euphoric tone.
Rates are the more relevant variable. Euro-area AAA yields are falling with a steepening curve: the 10Y AAA yield stands at 3.46%, down 16.7 bp over five days, and the 10Y-2Y spread is 47.2 bp. FX is a second-order factor for EUR investors: the euro is broadly weaker, with EUR/USD at 1.1233 (-0.50% over five days).
Against this backdrop, news-flow analysis frames Bitcoin’s setup as a contest between structural institutional demand and macro liquidity. U.S. spot Bitcoin ETFs attracted roughly $2.65 billion over five consecutive sessions led by BlackRock’s IBIT and Fidelity’s FBTC [T3], and a separate report cites about $2.4 billion in inflows even as a rally cooled on macro risks [T6]. The consistent lesson across sources: ETF inflows are constructive but do not eliminate sensitivity to rates, leverage and sentiment [T3]. Note that one source references a BTC price near $83,981 and a 10-year U.S. Treasury yield above 5.2% [T3]; those USD-basis observations predate or diverge from the EUR-basis market data in this bundle and are used here only as directional context, not as valuation anchors.
Investment Thesis
The institutional case for BTC in EUR terms rests on three pillars: absolute supply scarcity, maturing market structure, and regulated access through ETFs. On scarcity, 20.094 million of a fixed 21 million coins circulate, so more than 95% of issuance is complete and annual incremental supply is negligible relative to a €1.533 trillion market cap. Institutional entities, including ETFs, governments and public and private companies, are reported to hold approximately 18.5% of the fixed supply cap [T1].
On market structure, peer-reviewed analysis of one-minute BTC data from 2012 to 2025 finds realised volatility declining markedly, trading volume rising substantially, transaction costs falling sharply, and greater resilience to volatility shocks in the institutional period from 2021 to 2025 [T8]. The same study places Bitcoin close to, though not fully at, weak-form efficiency [T8]. This supports treating BTC as institutionalising collateral rather than a purely speculative asset.
On access, BlackRock’s iShares Bitcoin Trust became the fastest ETF in history to reach $10 billion in assets under management, doing so in 49 trading days after the January 2024 approval of U.S. spot ETFs [T1]. The bear-side counterweight is explicit in the same analysis: macroeconomic volatility and regulatory uncertainty continue to constrain short-term price growth, and it remains too early to declare the four-year cycle obsolete [T1].
Base case: BTC is a scarce, non-yielding, macro-sensitive asset with improving liquidity and persistent institutional demand. Bull case: deeper adoption and better microstructure justify a higher strategic allocation. Bear case: scarcity alone does not prevent valuation compression if demand slows or liquidity tightens.
Bullish Drivers
1. Persistent ETF demand. Bitcoin ETFs recorded $190.65 million of net inflows in one recent session versus $66.01 million for Ethereum ETFs, with six consecutive days of Bitcoin ETF inflows [T2]. A five-session window showed roughly $2.65 billion of U.S. spot Bitcoin ETF inflows [T3]. Flow consistency, not any single day, is the signal worth monitoring.
2. Structural adoption. Institutional demand is described as a strongly bullish driver for Bitcoin’s long-term trajectory, with institutional capital flows now rivalling halving-related supply shocks in influence [T1]. Institutional holdings account for roughly 30% of total crypto market capitalisation as of October 2025 per one market report [T4], a figure we treat with caution given reconciliation issues with the bundle’s market data.
3. Improving microstructure. Deeper liquidity, lower transaction costs and weaker volatility-shock persistence reduce the execution and risk-management friction that historically deterred institutional allocations [T8].
4. Positive medium-term momentum in EUR terms. BTC is +6.99% over 30 days and +21.37% over 200 days despite the one-year drawdown, indicating the drawdown phase has already given way to recovery. Falling euro-area yields (10Y AAA down 16.7 bp over five days) ease the discount-rate pressure on non-yielding assets for EUR-based holders.
Balanced caveat: strong ETF inflows do not guarantee rising prices; markets can still react sharply to leverage, macro data, interest rates and profit-taking [T2].
Relative Positioning vs Gold and Ethereum
The bundle specifies gold and Ethereum as benchmarks but provides no live gold or ETH price, market-cap or performance data. Quantitative relative valuation is therefore unavailable and this section stays qualitative, using only bundle-approved dominance and flow comparisons.
Versus gold: BTC shares gold’s scarcity profile (fixed 21 million cap versus slow mined supply growth) but lacks gold’s multi-century track record and central-bank demand base. Like gold, BTC is a non-yielding asset whose opportunity cost rises with real yields [T3]. One report describes BTC displaying safe-haven characteristics and flight-to-safety dynamics after geopolitical events, with parallels to precious metals [T5]; we weight this cautiously because the source is social-media derived.
Versus Ethereum: BTC holds a clear institutional-advantage lead on current flow evidence. Bitcoin ETFs drew $190.65 million in the referenced session versus $66.01 million for Ethereum ETFs, and Bitcoin has six consecutive inflow days against Ethereum’s five [T2]. With BTC dominance at 58.70% and a non-BTC crypto market cap of roughly €1.072 trillion, BTC remains the dominant store-of-value instrument within crypto.
Portfolio framing: BTC sits between gold-like scarcity and crypto-native growth exposure. A bullish relative scenario is continued BTC ETF flow leadership preserving the dominance premium; a bearish relative scenario is faster Ethereum adoption broadening or gold outperforming during risk-aversion episodes. Extension of this analysis to full quantitative comparison requires approved live gold and ETH data.
Scenario Framework
All scenarios are illustrative sensitivity exercises, not forecasts. Price is derived as assumed market cap divided by circulating supply of 20,093,996 BTC. Current anchors: spot €76,287, market cap €1.533 trillion, dominance 58.70%, ATH €107,662.
| Scenario | Assumptions | Implied market cap | Implied price | vs spot |
|---|---|---|---|---|
| Bear | Total crypto cap -20%, dominance falls to 54%, ETF flows reverse, yields rise | €2.084T × 54% = €1.125T | €56,050 | -26.5% |
| Base | Total crypto cap flat, dominance holds 58.70%, inflows continue, euro yields stabilise | €2.605T × 58.70% = €1.529T | €76,120 | -0.2% |
| Bull | Total crypto cap +15%, dominance rises to 60%, persistent inflows, falling yields | €2.996T × 60% = €1.797T | €89,470 | +17.3% |
| Stress | Sharp real-yield rise, broad risk-off; dominance holds but total cap -30% | €1.824T × 58.70% = €1.070T | €53,280 | -30.2% |
Recovery reference: a full retest of the €107,662 ATH implies €107,662 divided by €76,287 minus 1, or +41.1% upside from spot, consistent with the -29.14% ATH discount. Triggers to monitor per the news flow: daily ETF flows rather than isolated price moves, the 10-year Treasury yield and real rates, corporate buyer funding conditions, and U.S. and European regulatory developments [T3]. One flow-narrative source reports Bitcoin ETFs turned positive in 2026 after erasing a $5.8 billion deficit [T7]; treat this as low-confidence sentiment context.
Valuation Discussion
BTC has no conventional cash flows, so discounted-cash-flow valuation is not supported. The appropriate triangulation uses market cap, dominance, supply scarcity and the drawdown cycle.
Scarcity anchor: with 95.69% of max supply issued and only 906,004 BTC outstanding, scarcity is effectively complete. The FDV equals the market cap to within €0.7 million, so future issuance adds essentially no dilution. Valuation therefore depends almost entirely on demand, not supply expansion.
Dominance anchor: at 58.70% dominance of a €2.605 trillion total crypto market cap, BTC’s €1.533 trillion valuation implies the market pays a substantial store-of-value premium for BTC over the €1.072 trillion of non-BTC crypto assets combined.
Market-structure premium: the documented decline in realised volatility, transaction costs and liquidity-shock persistence supports a persistently higher institutional allocation than earlier cycles warranted [T8]. Structural demand through ETFs and corporate treasuries reinforces this [T1].
Drawdown anchor: at -29.14% from a €107,662 ATH set exactly one year ago, BTC trades in the middle of its historical drawdown distribution rather than at euphoric extremes. The base-case fair-value discussion should centre on partial drawdown recovery contingent on flow persistence and yield direction, rather than a single point target.
Bear-side valuation check: if total crypto market cap contracts and dominance slips, the bear scenario price of roughly €56,050 (26.5% below spot) shows how much of the current valuation rests on continued demand rather than on supply mechanics.
Risks
Cyclical risks. The 10-year Treasury yield and real rates are critical variables for near-term BTC valuation; higher yields raise the opportunity cost of holding non-yielding assets [T3]. Macro risks have already overshadowed ETF inflow surges during this cycle, reversing otherwise positive dynamics [T6]. Strong inflows do not prevent sharp reactions to leverage, macro data, rate expectations and profit-taking [T2].
Regulatory risks. Regulation is mixed: progress on crypto market rules is offset by political setbacks in Washington, the departure of SEC Commissioner Hester Peirce, and proposed German tax measures that could increase compliance costs for investors [T3]. For a EUR-denominated report, the German tax proposal is directly relevant to the domestic investor base.
Structural risks. Realised volatility remains a significant driver of liquidity shocks even though its magnitude and persistence have weakened [T8]. If institutional adoption stalls or microstructure gains reverse, the maturity premium embedded in current valuation would be challenged. The four-year cycle has not been proven obsolete [T1].
Performance context. BTC is down 31.09% over one year and 29.14% below ATH. This is not a hypothetical risk; it is realised drawdown within the last twelve months.
Currency risk. EUR/USD moved -0.50% over five days and -3.37% over one month. Euro-denominated returns embed both BTC performance and EUR crosses; these effects should be separated in attribution.
Appendix
Data and timestamps. Report generated 2026-10-06T04:15:27Z. Market data retrieved 2026-10-06T04:15:08Z; market overview retrieved between 04:15:15Z and 04:15:27Z. Observations are not fully synchronous. Quote currency is EUR throughout. The market-overview module reported no errors. Bundle market data is the primary source for price, market cap, supply, performance and dominance; the market-overview module serves only as macro backdrop.
Calculations shown. Volume/market cap: €25,963,345,403 ÷ €1,532,832,321,177 = 1.69%. Intraday range: €77,238 − €75,765 = €1,473; €1,473 ÷ €76,287 = 1.93%. Issued supply: 20,093,996 ÷ 21,000,000 = 95.69%. Remaining: 21,000,000 − 20,093,996 = 906,004 BTC (4.31%). BTC volume share: €25.96B ÷ €75.84B = 34.24%. Non-BTC crypto cap: €2,605.07B − €1,532.83B = €1,072.24B. ATH upside: €107,662 ÷ €76,287 − 1 = +41.1%. Scenario prices: assumed (total cap × dominance) ÷ 20,093,996 BTC.
Limitations. No live gold or ETH market data are provided, so relative positioning is qualitative. No on-chain metrics, exchange balances, futures funding, options skew, realised-volatility series or ETF AUM time series are available. The bundle provides euro-area rates but not U.S. Treasury yields; U.S. yield claims come solely from Tavily summaries. T4’s crypto market-size forecasts are inconsistent with the bundle’s market-cap data and were excluded from valuation. ETF-flow figures differ across sources and windows: T2 cites $190.65 million for one day, T3 cites about $2.65 billion over five sessions, and T6 cites about $2.4 billion; each figure is attributed to its own source and window. Several sources (T2, T3, T5, T7) are social-media or user-generated and carry lower evidentiary weight than T1 (professional research) and T8 (peer-reviewed study).
Source quality hierarchy. Prefer T8 and T1 for structural claims. Treat T2, T3, T5 and T7 as lower-confidence flow and sentiment context unless independently confirmed. T4 is used only for a hedged adoption datapoint.
Sources
- [T1] Wolf & Company, “The End of Bitcoin’s Four-Year Cycle? How ETFs and Institutions Are Reshaping the Market”: wolfandco.com
- [T2] Shah Faisal Shah, “Institutional Money Is Still Flowing into Crypto”: facebook.com
- [T3] Viktor Kopylov, “Bitcoin Faces Liquidity Test Amid Rising Treasury Yields”: linkedin.com
- [T4] Market Research Future, “Cryptocurrency Market Size, Share | Report Trends 2035”: marketresearchfuture.com
- [T5] AI Crypto Minds, “Silence as a New Asset Class in Macro Environment”: linkedin.com
- [T6] Moomoo, “Macro Risks Overshadow ETF Inflow Surge as Bitcoin Rally Cools”: moomoo.com
- [T7] TitoVlogs, “Bitcoin ETFs turn positive in 2026 after erasing a $5.8B deficit”: facebook.com
- [T8] “Maturation of Bitcoin market microstructure: Evidence of institutional-grade liquidity and efficiency (2012–2025)”, ScienceDirect: sciencedirect.com
Disclaimer. This report is AI-generated and for informational purposes only. It does not constitute investment advice, a recommendation, or an offer to buy or sell any security or financial instrument. Data may contain errors or gaps; readers should independently verify all figures before making decisions. Past performance does not predict future results.
Important Note / Wichtiger Hinweis:
EN: This report may have been generated using AI. It processes data from publicly available sources. The content is provided for informational purposes only.DE: Dieser Bericht kann mithilfe von KI erstellt worden sein. Dabei werden Daten aus öffentlich zugänglichen Quellen verarbeitet. Die Inhalte dienen ausschließlich Informationszwecken.
* DE: Die ergänzenden Inhalte können KI-generiert sein. EN: The additional content may be AI-generated.