
Watch the video
This player shows only the Bitcoin chapter of the daily altii market briefing. Watch the full video on tube.altii.de.
Key Data Snapshot
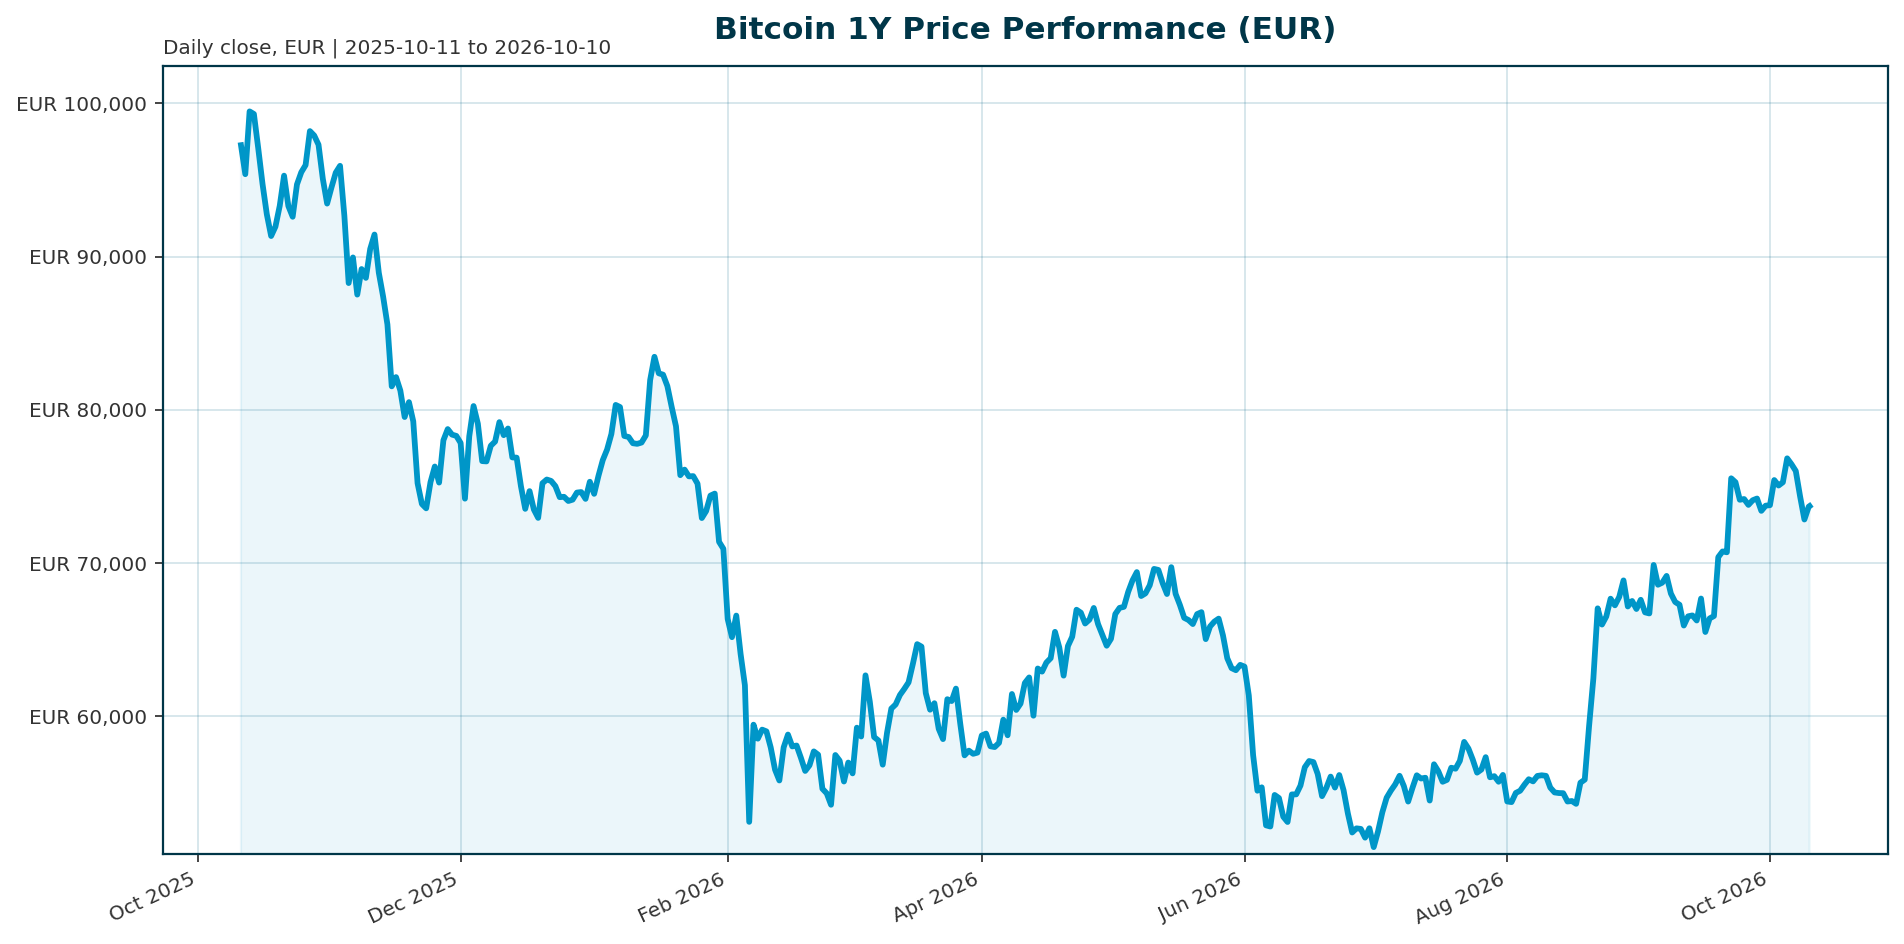
All figures in EUR as of 2026-10-10, retrieved 04:15 UTC.
| Metric | Value | Note |
|---|---|---|
| Spot price | €73,757 | 24h range €73,355 to €74,443 (1.48% band) |
| Market capitalization | €1,482,164,924,567 | Rank #1 in crypto |
| 24h volume | €21,386,938,048 | 1.44% of market cap (21,386,938,048 / 1,482,164,924,567) |
| BTC dominance | 59.10% | Verified: 1,482,165 / 2,504,116 total crypto market cap ≈ 59.2% |
| Performance 24h / 7d / 30d | +0.43% / -2.44% / +5.35% | Mixed short-term picture |
| Performance 200d / 1y | +17.16% / -31.87% | Medium-term recovery, deep annual drawdown |
| All-time high | €107,662 (2025-10-06) | -31.49% below ATH; recovery requires +45.97% (107,662 / 73,757 – 1) |
| Circulating supply | 20,095,943 BTC | 95.70% of 21m cap; 904,057 BTC remain |
| FDV | €1,482,164,924,567 | Equals market cap; see data note in Appendix |
Market Setup
The cross-asset backdrop is neutral rather than risk-on: risk sentiment is rated neutral, equity momentum is mixed with DACH indicators averaging -1.83% over five days versus -0.13% globally, euro rates are mixed with the euro area AAA 10Y yield at 3.52% (up 5.5 bp over five days) and a 10Y-2Y spread of 48.6 bp, and FX is mixed with EUR/USD at 1.1216, down 0.20% over five days. This matters for BTC because Bitcoin now trades partly as a macro liquidity asset, reacting to both exchange positioning and broader financial conditions [T8]. Elevated or rising euro yields give European institutional buyers a credible yielding alternative to a non-yielding digital asset, and a softer EUR/USD mechanically lifts the EUR-quoted price of a USD-linked asset, flattering reported returns. This context is subordinate to the Bitcoin-specific picture but shapes it.
Within crypto, the dominant variable is regulated capital movement. ETF flows have become Bitcoin’s new macro indicator, and record outflows from US-listed BTC and ETH ETFs in late 2025 coincided with the break of key support levels [T1]. Current USD spot implied by the bundle is approximately $82,730 (73,757 × 1.1216), a level that recent commentary identified as contested resistance [T6].
Investment Thesis
Bitcoin’s institutional thesis rests on the intersection of absolute supply scarcity and rapidly maturing access infrastructure. With 20,095,943 of 21,000,000 coins already issued and 59.10% dominance over a €2.50 trillion crypto market, Bitcoin is the default allocatable crypto line item. By end-2025, Glassnode counted 6.7 million BTC across ETFs, exchanges, and treasuries, a period it described as Bitcoin’s institutional supply era [T1]. Spot ETFs, corporate treasuries, and regulated vehicles have turned BTC into a standard portfolio holding for registered investment advisors, private banks, and institutions [T1].
The bull framing: regulatory progress, on-chain infrastructure, and structural adoption continue to build even while near-term price action is under pressure [T2]. Scarcity is fixed, so re-rating depends on demand. The bear framing: that demand is flow-driven and cyclical, and the 1-year return of -31.87% shows institutionalization has not removed high-beta drawdown risk [T1]. The practical question for a EUR allocator is whether sustained ETF inflows can overcome tighter liquidity and higher-yield competition.
Bullish Drivers
- ETF flows as marginal demand. Weekly inflows of $1.92 billion were recorded in late August 2026, with BlackRock’s IBIT dominating, evidence of a deepening institutional footprint rather than retail speculation [T7]. Daily inflows were cited at over $400 million [T3], with a $467 million single-day print in May marking a fourth consecutive positive day [T4].
- Regulatory catalyst. The CLARITY Act would establish a federal market-structure framework and could unlock broader institutional participation if passed [T2].
- Supply scarcity. 95.70% of maximum supply is in circulation, and the remaining 904,057 BTC cannot grow; halving-cycle dynamics have been augmented by institutional demand vectors [T3].
- Market infrastructure. Fee competition among ETF providers and custody buildout have made Bitcoin exposure cheaper and easier to access, expanding the addressable institutional market [T5].
- Forced liquidity channel. Treasury buyback operations and liquidity signals shape risk appetite; improving conditions historically coincide with BTC strength as a macro liquidity asset [T8].
Counterweight: these flow figures come from different observation windows and regimes. Flows have also flipped sharply negative before, with weekly outflows exceeding $700 million removing a key source of spot demand [T6].
Relative Positioning vs Gold and Ethereum
Vs gold. The institutionalization narrative positions BTC as a competitor for store-of-value allocations, with models explicitly targeting market-share capture from gold [T3]. In practice, the relationship has been asymmetric: in the Q4 2025 correction Bitcoin lagged gold and bonds while erasing over $1 trillion in market value, falling nearly 30% from peak [T1]. Bitcoin offers scarcity and portability gold cannot match; gold offers stability and a multi-century track record Bitcoin cannot match. Without current gold price data in this bundle, a quantitative gold comparison is unavailable. Vs Ethereum. At 59.10% dominance and rank #1, Bitcoin remains the primary institutional crypto allocation, favored for perceived simplicity and monetary policy clarity. ETH-specific ETF and network data are not provided in this bundle, so relative ETH positioning is stated qualitatively only. Note that Asia-Pacific adoption favors tokenization and stablecoin rails over pure BTC ETF exposure, a structural difference from North American and European patterns [T2].
Scenario Framework
USD targets from cited external sources are converted at EUR/USD 1.1216 (EUR = USD / 1.1216). Implied USD spot equivalent is approximately $82,730. These are scenario anchors from third parties, not altii forecasts.
| Scenario | USD anchor (source) | EUR equivalent | Return vs €73,757 |
|---|---|---|---|
| Bear: flows stay negative, yields firm | Below ~$82,000 resistance [T6] | < €73,120 | Negative |
| Base: conservative 2026 range | $85,000 to $118,000 [T5] | €75,784 to €105,207 | +2.8% to +42.6% |
| Bull: adoption-led 2026 range | $100,000 to $150,000 [T3] | €89,158 to €133,738 | +20.9% to +81.3% |
| Extension: flow-model peak | $150,000 JPMorgan, Q4 2026 [T3] | €133,738 | +81.3% |
| Extension: aggressive milestone | $200,000 (2026) / $1m (2030), Ark [T3] | €178,317 / €891,585 | +141.8% / +1,109% |
| Long-cycle bull | $300,000 to $500,000 by 2029 [T5] | €267,476 to €445,794 | +262.7% to +504.1% |
The extension rows depend on favorable Federal Reserve policy shifts and sustained adoption [T5]; they should be treated as high-conditionality narratives, not base cases. Note the base-case floor of $85,000 sits only ~2.7% above the implied USD spot, meaning much of the cited 2026 range is already within a modest move of current levels.
Valuation Discussion
Bitcoin lacks cash flows, so institutional valuation relies on flow-based, scarcity-based, and relative frameworks. The flow-based approach, exemplified by the cited JPMorgan model with a $150,000 peak target and 72% confidence [T3], treats ETF net inflows as the most tangible leading indicator of institutional capital rotation [T2]. At the current €1.482 trillion market cap, valuation expansion requires incremental regulated demand; the $1.92 billion weekly inflow episode [T7] and the >$700 million weekly outflow episode [T6] illustrate how quickly the marginal buyer can flip. The scarcity approach assigns value to the fixed 21 million cap with 95.70% already issued; re-rating improves as access infrastructure deepens. The mean-reversion approach anchors on the €107,662 ATH, implying +45.97% upside, but a return to ATH requires confirmation from both flows and macro easing. The compression approach warns that euro area AAA 10Y yields at 3.52% and rising US yields make non-yielding assets compete harder for allocation [T6]. A data note: the reported FDV equals market cap, implying price × max supply of roughly €1.549 trillion (73,757 × 21,000,000), a ~4.5% discrepancy we flag rather than resolve.
Risks
- ETF flow reversal. ETF outflows became a direct transmission channel for drawdowns; record outflows coincided with support breaks in late 2025 [T1], and >$700 million weekly outflows removed key spot demand [T6].
- Rate and liquidity pressure. Higher yields make institutional buyers more selective as government debt offers a stronger return profile [T6]. The Fed is expected to hold rates, limiting the easing that has historically supported risk-asset recoveries [T2]. Euro AAA yields rose over the recent five-day window.
- Regulatory disappointment. CLARITY Act passage is a catalyst but not a guarantee; delay or dilution would remove a key bullish pillar [T2].
- High-beta drawdown behavior. Despite institutionalization, Bitcoin remains a high-beta corner of global markets and lagged gold and bonds in the Q4 2025 correction [T1].
- Technical failure. Failed tests of key levels, such as the $70,000 squeeze episode, risk triggering liquidation cascades rather than constructive consolidation [T8].
- FX risk for EUR investors. EUR/USD swings alter translated returns; a stronger euro would mechanically reduce EUR-quoted prices.
- Data limitations. No current gold or ETH data, on-chain metrics, ETF AUM, volatility, or derivatives positioning are provided in this bundle, limiting cross-asset and market-structure precision.
Appendix
Supporting calculations. Volume/market cap: 21,386,938,048 / 1,482,164,924,567 = 1.443%. 24h range: (74,443 – 73,355) / 73,757 = 1.475%. Upside to ATH: 107,662 / 73,757 – 1 = 45.97%. Circulating share of max supply: 20,095,943 / 21,000,000 = 95.695%; remaining 904,057 BTC. Implied USD spot: 73,757 × 1.1216 ≈ $82,730. EUR conversions use USD / 1.1216.
Data notes. Market data retrieved 2026-10-10T04:15:07Z; bundle generated 2026-10-10T04:15:21Z. The reported FDV equals market capitalization despite circulating supply being below max supply; this appears to be a provider inconsistency and is flagged, not corrected. Cited USD scenario targets refer to different dates and regimes and are not a continuous time series. No independent current gold or Ethereum market data is included in the bundle; relative positioning vs those benchmarks is therefore qualitative.
Sources
- [T1] Crypto Market 2025: Year-End Review & Expert Insights. tradingview.com
- [T2] Q2 2026 Digital Asset Review. coindesk.com
- [T3] Bitcoin Price Prediction 2026: Institutional Adoption & ETF Impact Analysis. intellectia.ai
- [T4] Bitcoin Price Analysis, May 2026. intellectia.ai
- [T5] Bitcoin Price Prediction 2026 (May 10 update). intellectia.ai
- [T6] US Treasury yields surge to new highs as liquidity tightens, pushing Bitcoin back below $82,000 resistance. cryptoslate.com
- [T7] Bitcoin ETF Inflows Surge to $1.92 Billion Last Week. cryptonomist.ch
- [T8] Bitcoin Tests $70,000 As Intraday Squeeze Lifts Market. cryptorank.io
Disclaimer. This report is AI-generated, for informational purposes only, and does not constitute investment advice. Figures are drawn from automated data retrieval and third-party sources at the timestamps indicated; scenario targets are external views converted at a single FX rate and carry material uncertainty. Readers should conduct their own due diligence before making investment decisions.
Important Note / Wichtiger Hinweis:
EN: This report may have been generated using AI. It processes data from publicly available sources. The content is provided for informational purposes only.DE: Dieser Bericht kann mithilfe von KI erstellt worden sein. Dabei werden Daten aus öffentlich zugänglichen Quellen verarbeitet. Die Inhalte dienen ausschließlich Informationszwecken.
* DE: Die ergänzenden Inhalte können KI-generiert sein. EN: The additional content may be AI-generated.