
Watch the video
This player shows only the Bitcoin chapter of the daily altii market briefing. Watch the full video on tube.altii.de.
Key Data Snapshot
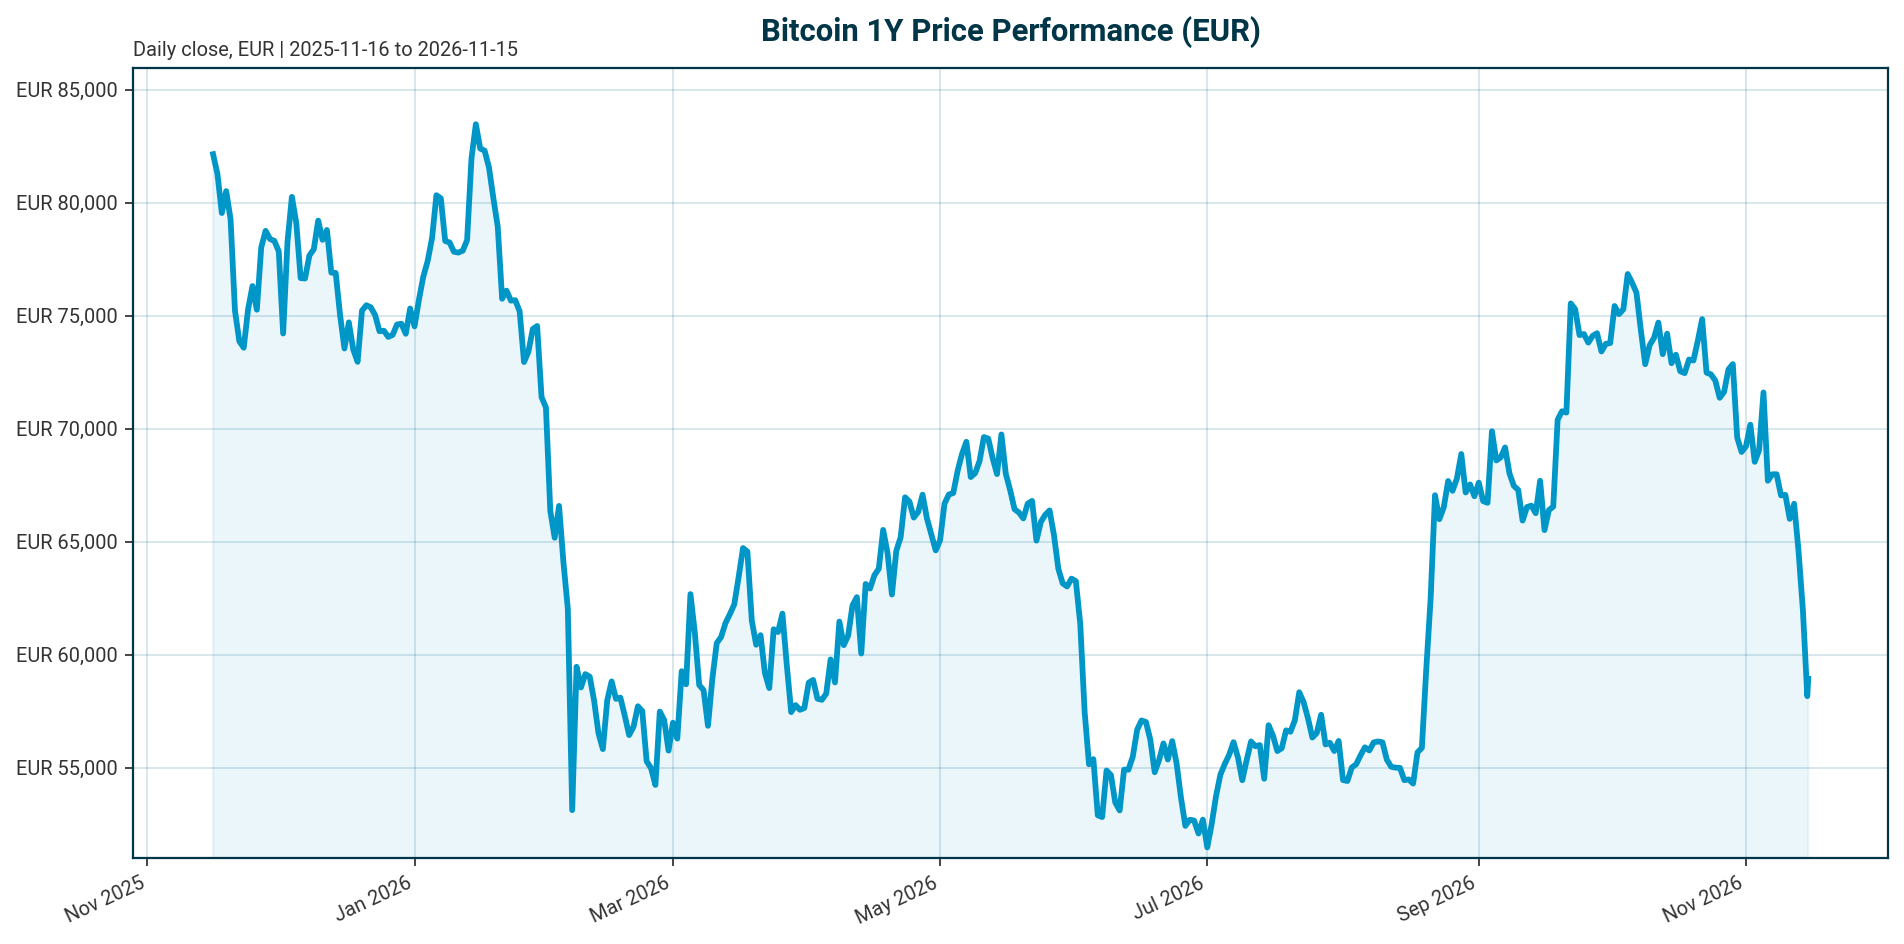
All Bitcoin figures are EUR-denominated and retrieved 2026-11-15 at 05:15 UTC via CoinGecko. Macro reference points are as of the dates shown.
| Metric | Value | Note |
|---|---|---|
| Price | EUR 58,812 | 24h range EUR 56,319 to 61,183 |
| Change 1h / 24h / 7d | +0.34% / -3.46% / -14.33% | Negative momentum across all major horizons |
| Change 14d / 30d / 200d / 1y | -16.45% / -20.81% / -15.61% / -32.54% | Deep, persistent drawdown |
| Market cap | EUR 1,182.83 billion | Rank 1; 24h change -3.45% (-EUR 42.23 billion) |
| 24h volume | EUR 46.43 billion | ~3.93% of market cap (46.43 / 1,182.83) |
| All-time high | EUR 107,662 (2025-10-06) | Current drawdown -45.37% ((58,812 – 107,662) / 107,662) |
| All-time low | EUR 51.30 (2013-07-04) | +114,546% since |
| Supply | 20,112,050 of 21,000,000 | 95.77% issued; 887,950 BTC remaining |
| Fully diluted valuation | EUR 1,182.83 billion | FDV/market cap ratio ~1.0000; negligible dilution overhang |
| Fed funds target range | 3.75% to 4.00% | As of 2026-11-14; last change a 25 bp hike effective 2026-09-17 |
| ECB deposit facility rate | 2.50% | As of 2026-11-15; last change a 25 bp hike effective 2026-09-16 |
| Euro area AAA 10Y yield | 3.37% | As of 2026-11-12; +8.2 bp over 5 days, +41.9 bp YTD |
| EUR/USD | 1.1079 | As of 2026-11-15; -0.88% over 5 days, -5.71% YTD |
| DAX / S&P 500 | 26,749.95 / 7,561.67 | As of 2026-11-13; DAX +5.74% over 1 month, S&P 500 -2.04% |
| BTC dominance / total crypto market cap | Unavailable | Not in the dataset |
Market Setup
The cross-asset backdrop is neutral in overall risk sentiment but moderately negative in equity momentum, with DACH markets outperforming: DACH indicators average +1.62% over five days versus +0.10% for global equity indicators. The DAX leads on a one-month basis at +5.74%, while the Hang Seng is the weakest five-day performer at -3.32% and the Nikkei 225 the strongest at +4.03%. Rates are a headwind: euro-area AAA yields are mixed with a flattening curve, the AAA 10Y at 3.37% (+8.2 bp over five days, +41.9 bp YTD) and the 10Y-2Y spread at 29.2 bp. FX is mixed, with EUR/USD at 1.1079, down 0.88% over five days and 5.71% YTD. Policy is restrictive on both sides of the Atlantic: the Fed funds target range stands at 3.75% to 4.00% after a 25 bp hike effective 2026-09-17, and the ECB deposit facility rate is 2.50% after a 25 bp hike effective 2026-09-16.
Within this regime, Bitcoin is hostage to cross-asset risk appetite rather than idiosyncratic crypto catalysts. Its one-year EUR return of -32.54% contrasts with a DAX YTD of +1.17% and a Euro Stoxx 50 YTD of +10.58% (a horizon mismatch, as equity one-year changes are not in the dataset). A further rise in euro-area AAA 10Y yields above 3.37% would, by assumption, tighten the liquidity backdrop for BTC-EUR; a reversal would ease it. The weaker euro has cushioned EUR-quoted returns relative to USD-quoted Bitcoin performance, an FX effect EUR-based investors must track explicitly.
Investment Thesis
Bitcoin has institutionalized, but the current drawdown exposes a spot-demand gap. The asset now trades through regulated channels: crypto ETFs briefly exceeded USD 200 billion in assets and received more than USD 40 billion of inflows in 2025, according to a Morgan Stanley insights piece [T8]. Yet the flow engine stalled in 2026. Q2 2026 spot bitcoin ETF net redemptions reached USD 4.67 billion, the largest quarterly outflow since spot products launched in January 2024, with June alone setting a monthly redemption record, according to the CoinDesk Indices Q2 2026 review from July 2026 [T1]. ETF flows have effectively become Bitcoin’s primary macro indicator; record Q4 2025 outflows coincided with the break of roughly USD 98,000 support, per a 2025 year-end review [T2].
The core tension is between infrastructure and demand. On-chain analysis from XWIN Research Japan shows the Coinbase Premium Index, the price gap between the primary US institutional venue and offshore exchanges, has repeatedly turned negative in 2026, and exchange stablecoin “dry powder” has declined, indicating institutional plumbing has outpaced actual spot buying [T4]. Against that, holders have not capitulated: institutions and retail held through a roughly 50% drawdown, the ~USD 100 billion US spot ETF complex shed only about 15% of retail interest, UAE sovereign wealth funds and family offices bought the discount, and Strategy held 845,256 BTC as of June 8, 2026, per a Yahoo Finance article undated in the dataset [T7].
The investment case therefore rests on two observable variables: a sustained return to positive ETF net flows, and passage of US market-structure legislation including the CLARITY Act. If both materialize, the built infrastructure converts into durable demand. If neither does, the restrictive Fed range of 3.75% to 4.00% and absent spot demand keep BTC-EUR rangebound well below its EUR 107,662 all-time high.
Bullish Drivers
- Flow recovery precedent. In August 2026, Bitcoin rallied from the low-USD 60,000s to around USD 80,000, gaining nearly 20% in one week on macro tailwinds, short covering, regulatory optimism and renewed ETF demand, according to an ETFfdb-sourced article dated 2026-08-27 [T5]. Strong August inflows across bitcoin, ethereum, Solana and XRP products improved the September outlook [T3].
- Institutional conviction. JPMorgan’s stake in Strategy jumped 36%, with bitcoin ETF bets reaching USD 540 million, reinforcing confidence in regulated crypto products, per a Cryptonews article undated in the dataset [T6].
- Regulatory pipeline. Seven US market-structure bills are circulating and could lower institutional barriers [T7]. The CLARITY Act would establish a federal market-structure framework and potentially unlock broader institutional participation if passed [T1]. Hong Kong’s Stablecoins Ordinance, requiring full reserve backing and redemption rights, shows global regulatory maturation [T1].
- Volatility compression. Bitcoin’s volatility fell from 84% to 43%, per the Glassnode x Fasanara Digital Assets Report 2025 cited in a year-end review, supporting the maturing institutional-asset narrative [T2].
- Supply scarcity. 95.77% of the 21 million cap is issued (20,112,050 / 21,000,000), leaving 887,950 BTC of future issuance.
- Cycle expectation. One market commentator expects ETF and ETP inflows to re-accelerate as regulatory clarity improves, potentially pushing Bitcoin toward USD 200,000 over the next full cycle if macro conditions cooperate, according to a 2025 year-end review [T2]. This is a dated market expectation, not a forecast.
Relative Positioning vs Gold and Ethereum
The bundle contains no gold or ethereum price series, so direct relative-return calculations are unavailable and the comparison is necessarily qualitative and flow-based.
Versus gold: Bitcoin competes for the same inflation-hedge and debasement-trade allocations that traditionally favor gold. Morgan Stanley notes pension funds, endowments and foundations have begun small bitcoin allocations as a long-term inflation hedge [T8], the same demand bucket that anchors gold. The August 2026 rebound was explicitly framed as a revival of the debasement trade [T5]. The trade-off is beta: if risk sentiment deteriorates from neutral, gold would likely capture defensive flows first, while Bitcoin offers higher upside in a risk-on debasement regime.
Versus ethereum: Ethereum ETFs recorded USD 690 million in net outflows in Q2 2026, far smaller in scale than bitcoin’s USD 4.67 billion redemptions [T1]. A smaller outflow base could allow faster percentage flow recovery, but bitcoin retains the deeper ETF complex, rank-1 market cap status and the primary institutional allocation channel. During the August 2026 rebound, flows into Ether, Solana and XRP suggested broadening crypto risk appetite rather than bitcoin-specific demand [T5], which cuts both ways: it confirms crypto beta is bid, but dilutes bitcoin’s claim on incremental institutional capital. Regionally, pure bitcoin ETFs play a smaller strategic role in Asia than in North America and Europe, where tokenization and stablecoins serve as bank entry points [T1].
Scenario Framework
Four observable trigger variables drive the framework: the sign and magnitude of weekly spot ETF net flows (Q2 2026 baseline: USD 4.67 billion net outflows [T1]; August 2026: positive inflows [T3] [T5]); CLARITY Act and market-structure legislative progress, with a September 15 vote flagged as a wildcard [T3] and seven bills circulating [T7]; the Fed policy path, with the target range at 3.75% to 4.00% after a 25 bp hike effective 2026-09-17 (a July 2026 review reported expectations of a hold through Q3 under Chair Kevin Warsh, a dated expectation since overtaken by the September hike [T1]); and spot-demand gauges, namely the Coinbase Premium Index sign and the exchange stablecoin ratio [T4]. The ECB deposit rate at 2.50% and the euro-area AAA 10Y at 3.37% frame the European liquidity backdrop.
- Bull scenario (analyst assumption weight ~25-30%): The CLARITY Act advances, ETF flows turn sustainably positive, and the Fed moves toward easing from 3.75% to 4.00%. BTC-EUR reclaims ground toward the EUR 80,000 to 100,000 zone implied by the August 2026 rebound trajectory and prior-cycle commentary. Confirmation signal: consecutive positive weekly ETF prints.
- Base scenario (analyst assumption weight ~45-50%): The Fed holds at 3.75% to 4.00%, ETF flows oscillate between inflow and outflow weeks, and legislation progresses incrementally. BTC-EUR ranges roughly between EUR 50,000 and EUR 70,000 with the ~45% drawdown persisting.
- Bear scenario (analyst assumption weight ~25%): ETF redemptions resume at Q2 2026 scale (USD 4.67 billion per quarter), the Coinbase Premium stays negative, and no legislation passes. BTC-EUR breaks below the recent 24h low of EUR 56,319 and extends the one-year loss beyond -32.54%.
All probability weights are analyst assumptions for structuring, not model outputs; the weights sum to 100%. Each trigger is a weekly observable data point.
Valuation Discussion
Bitcoin has no cash flows, so valuation rests on scarcity, flow dynamics and drawdown context. On scarcity: circulating supply of 20,112,050 against the 21,000,000 cap means 95.77% is issued, and the fully diluted valuation of EUR 1,182.83 billion is essentially identical to market cap (ratio ~1.0000), so dilution overhang is negligible. On drawdown: at EUR 58,812, Bitcoin trades at roughly 0.55x its EUR all-time high of 107,662, a 45.37% discount, and the market cap shed EUR 42.23 billion in 24 hours, showing the intensity of current pressure.
Valuation is flow- and liquidity-driven. The operative signals are ETF net flows [T1] [T2], stablecoin dry powder and the Coinbase Premium Index [T4], not fundamentals in the equity sense. Whether the current level is attractive depends on which regime dominates next: the institutional-era flow regime described in the 2025 year-end review [T2], or the spot-demand gap flagged for 2026 [T4]. Buyers at the discount include UAE sovereign wealth funds and family offices, per a Yahoo Finance article undated in the dataset [T7]; the “roughly 50% drawdown” in that article is directionally consistent with, but not identical to, the bundle’s -45.37% figure.
Two caveats for EUR investors. First, USD-quoted levels in sources (USD 98,000 support, USD 80,000 rebound, USD 200,000 cycle target) do not map cleanly to EUR 58,812; at the reference rate of EUR/USD 1.1079 as of 2026-11-15, USD 98,000 converts to roughly EUR 88,460, but conversion timing in the sources is ambiguous and these figures are cited as USD news facts. Second, if the 43% realized-volatility regime holds, drawdown-based entry frameworks become more viable for allocators than in the 84%-volatility era; this is an assumption contingent on volatility compression persisting [T2].
Risks
- Policy risk. The Fed funds target range of 3.75% to 4.00% follows a 25 bp hike effective 2026-09-17, and the ECB deposit rate of 2.50% follows a 25 bp hike effective 2026-09-16. A July 2026 review noted limited room for policy easing under Chair Kevin Warsh, a dated expectation that restrictive policy persists [T1]. Higher-for-longer rates pressure duration-like risk assets.
- Flow-reversal risk. Q2 2026 demonstrated that ETF flows can reverse violently: USD 4.67 billion in quarterly redemptions and a record June [T1]. A repeat would pressure BTC-EUR below recent lows.
- Structural demand-gap risk. Negative Coinbase Premium readings and declining stablecoin dry powder in 2026 suggest the adoption narrative may not convert into spot demand [T4].
- Regulatory risk. CLARITY Act passage is uncertain; the September 15 vote was flagged as a wildcard [T3]. Separately, MSCI’s review of index treatment for digital-asset-treasury companies such as Strategy could trigger passive-flow changes independent of Bitcoin’s price [T6].
- Concentration risk. Strategy’s 845,256 BTC holding as of June 8, 2026 [T7] creates treasury-company reflexivity: forced or passive selling by such vehicles could amplify price moves.
- EUR-investor risk. EUR/USD at 1.1079 (-5.71% YTD) means EUR returns embed FX translation. A euro rally would amplify EUR-quoted losses even if USD-quoted Bitcoin stabilizes.
- Momentum risk. Negative returns across 7d (-14.33%), 30d (-20.81%) and 1y (-32.54%) horizons, with only a marginal 1h bounce of +0.34%, indicate no confirmed bottom.
Appendix
Methodology and Data Provenance
Market data was retrieved 2026-11-15 at 05:15 UTC via CoinGecko. Equity data is as of 2026-11-13; ECB yield-curve data as of 2026-11-12; FX data as of 2026-11-15; policy rates as of 2026-11-14 (Fed) and 2026-11-15 (ECB). Labeling convention: figures from the data bundle are current facts; figures from Tavily sources are dated news facts, flagged as undated in the dataset where applicable; all forward-looking statements are scenario assumptions. USD-denominated news figures are cited in USD; EUR conversions use the reference rate EUR/USD 1.1079 as of 2026-11-15 and are marked as approximate. BTC dominance and total crypto market cap are unavailable in the dataset. The designated benchmark assets are gold and ethereum; neither has a price series in the current bundle, so relative-return calculations are unavailable.
Glossary
- Coinbase Premium Index: The price gap between Coinbase, the primary US institutional spot venue, and offshore exchanges such as Binance; positive readings indicate US institutional spot demand.
- Exchange Stablecoin Ratio: A gauge of stablecoin “dry powder” on exchanges available for spot deployment; declines suggest less waiting capital.
- FDV: Fully diluted valuation, price multiplied by maximum supply.
- Spot ETF net flows: creations minus redemptions across US-listed spot bitcoin ETFs; the primary institutional demand indicator.
- CLARITY Act: Proposed US federal market-structure legislation for digital assets.
- Deposit facility rate: The ECB’s key policy rate for overnight deposits, at 2.50% as of 2026-11-15.
Sources
- [T1] Q2 2026 Digital Asset Review (CoinDesk Indices, July 2026): link
- [T2] Crypto Market 2025: Year-End Review & Expert Insights (TradingView News): link
- [T3] Crypto ETFs Enter a New Phase in September (Bitcoin Foundation): link
- [T4] Bitcoin’s 2026 Market Structure Reveals A Problem Hidden Beneath ETF Growth (TradingView News / XWIN Research Japan): link
- [T5] Bitcoin Leads Broader Rebound (etfdb.com, 2026-08-27): link
- [T6] Strategy Stake Held by JPMorgan Jumps 36% as Bitcoin ETF Bets Hit $540M (Cryptonews, undated in dataset): link
- [T7] Both Institutions and Retail Are Buying and Holding Crypto Despite Bitcoin’s 50% Pullback (Yahoo Finance, undated in dataset): link
- [T8] Digital Assets Go Mainstream as Global Adoption Accelerates (Morgan Stanley Insights): link
Disclaimer
This report is AI-generated and provided for informational purposes only. It does not constitute investment advice, a recommendation, or an offer to buy or sell any financial instrument. Figures are drawn from the cited data sources as of the dates indicated and may be incomplete or inaccurate. Scenario probabilities are analyst assumptions, not model outputs. Readers should conduct their own due diligence and consult a licensed financial advisor before making investment decisions.
Important Note / Wichtiger Hinweis:
EN: This report may have been generated using AI. It processes data from publicly available sources. The content is provided for informational purposes only.DE: Dieser Bericht kann mithilfe von KI erstellt worden sein. Dabei werden Daten aus öffentlich zugänglichen Quellen verarbeitet. Die Inhalte dienen ausschließlich Informationszwecken.
* DE: Die ergänzenden Inhalte können KI-generiert sein. EN: The additional content may be AI-generated.