
Listen to the summary
Key Data Snapshot
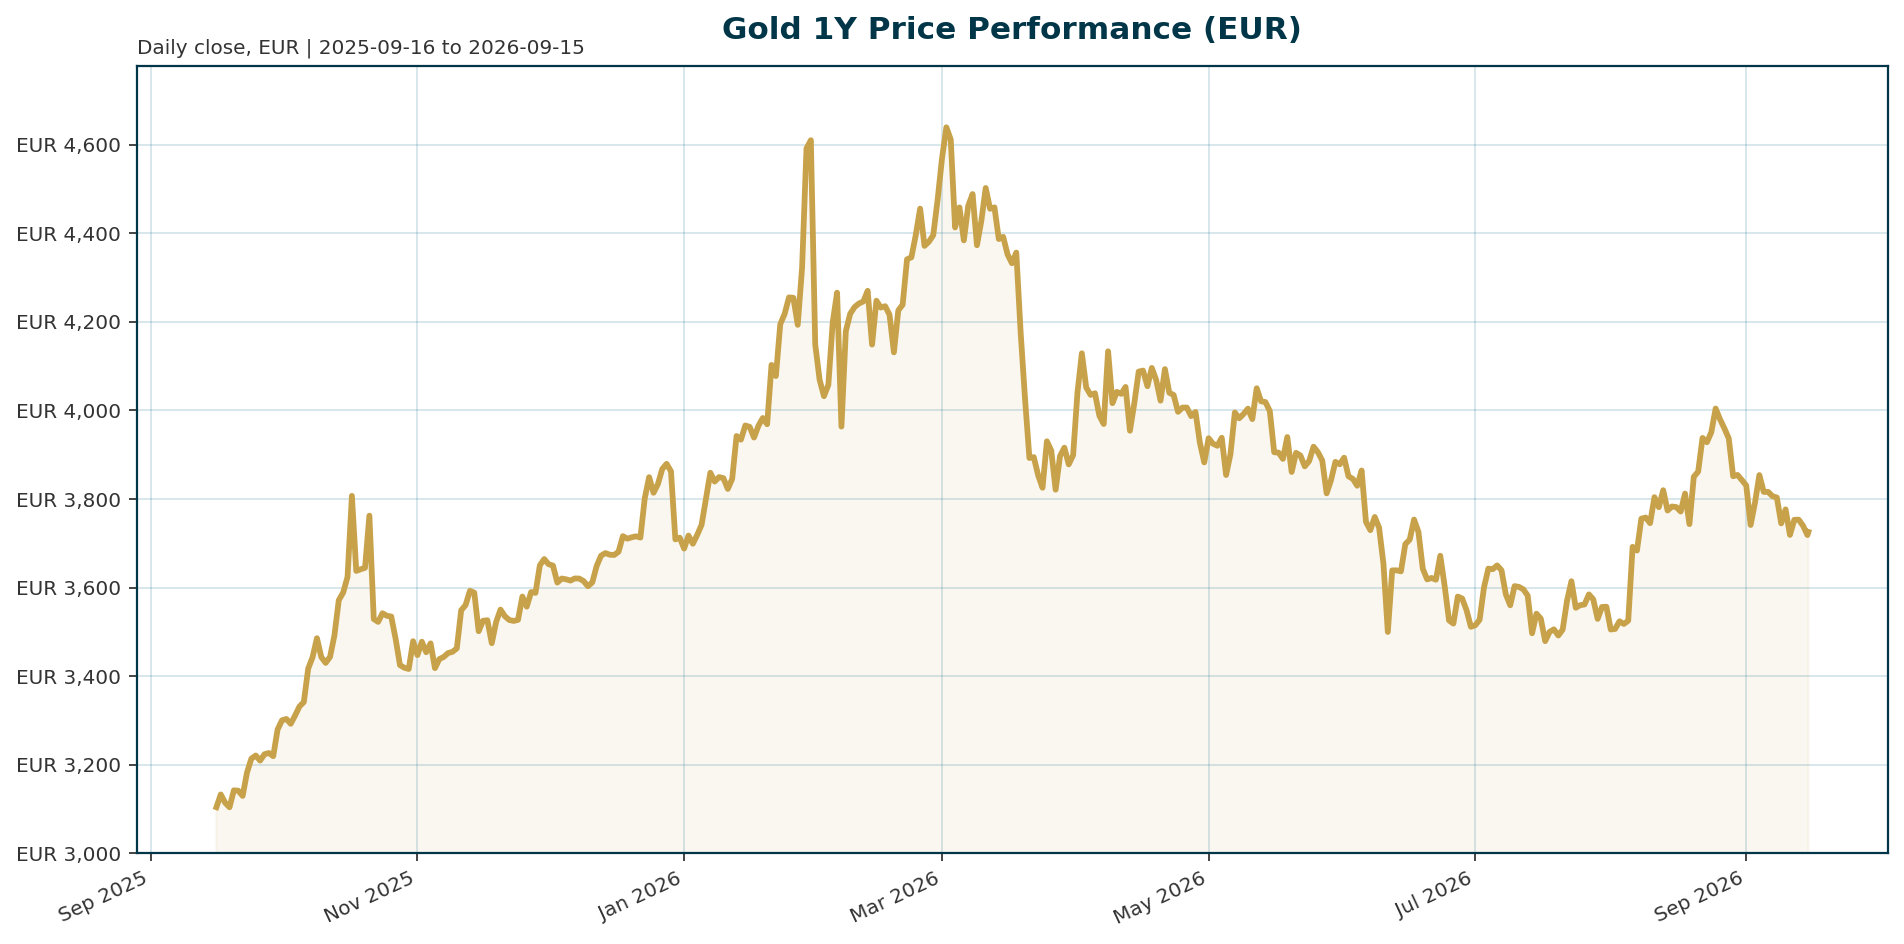
Gold (XAU) quoted in EUR, data as of 2026-09-15 04:47 UTC.
| Metric | Value | Note |
|---|---|---|
| Spot XAU/EUR | EUR 3,732.61 | Market price proxy |
| 1h / 24h change | -0.20% / -0.29% | Mild intraday softness |
| 7d / 14d / 30d change | -2.70% / -3.10% / -1.60% | Short-term correction |
| 200d / 1y change | -17.20% / +18.00% | Consolidation after prior advance |
| 24h range | EUR 3,698.44 to 3,762.40 | Range = 1.71% of spot; price sits ~53% up the range |
| All-time high (dataset) | EUR 4,688.32 (2026-01-28) | Drawdown: 3,732.61 / 4,688.32 – 1 = -20.38% |
| Upside to ATH | +25.60% | 4,688.32 / 3,732.61 – 1 |
| All-time low (dataset) | EUR 1,265.28 (2019-11-17) | Spot is +195.00% above ATL |
| Token proxy market cap | USD-equivalent proxy: EUR 1,615.99m | Tokenized gold proxy, not physical market value |
| Token proxy 24h volume | EUR 122.90m | Turnover proxy: 122.90m / 1,615.99m = 7.61% of market cap |
| EUR/USD | 1.1576 | -0.34% over 5 days |
| Implied XAU/USD | ~USD 4,320.87 | 3,732.61 × 1.1576 |
Market cap, circulating supply (432,906.6 units), rank (48) and volume refer to a tokenized gold proxy (PAX Gold) used as the price feed. They do not represent the global physical gold market. Direct USD gold pricing, real yields, inflation breakevens and policy-rate expectations are unavailable in this dataset and are addressed qualitatively via cited sources.
Macro Backdrop
Market overview: Cross-asset risk sentiment is negative and equity momentum is moderately negative, with DACH indicators averaging -2.12% over five days versus -1.41% for global peers. The rates backdrop shows euro-area yields rising with a flattening curve: the AAA 10Y yield stands at 3.52%, up 13.3 bp over five days, and the 10Y-2Y spread has compressed to 39.5 bp (calculation: 3.5227% – 3.1276% = 39.5 bp). FX is mixed, with EUR/USD at 1.1576, down 0.34% over five days. This context is secondary to the gold-specific analysis below.
Gold-specific framing: Sell-side research converges on a dual-driver framework. Real yields remain the dominant cyclical swing factor: UBS attributes gold’s recent weakness to sharply higher real yields, which raise the opportunity cost of a non-yielding asset, and argues that falling or less burdensome real yields would be an important catalyst [T3]. ING concurs that macro forces, not geopolitical headlines alone, are driving gold, and that a higher-for-longer rate environment is a headwind, while stagflation remains structurally supportive [T4]. Against this, Société Générale identifies a post-2022 regime shift: despite persistently positive real yields, gold trades near record highs because central-bank purchases, dedollarisation, geopolitical uncertainty and sovereign-debt concerns provide a higher price floor [T1]. Saxo commentary flags the most challenging combination as renewed inflation or employment strength reviving real yields and the dollar together [T2]. For EUR-based holders, rising euro-area nominal yields add a second opportunity-cost layer, though these are nominal, not real, yields and should not be mechanically equated with gold’s real-yield driver.
Investment Thesis
Our base view is constructive but not aggressively pro-cyclical. Gold in EUR terms is consolidating after a powerful 2025, in which the metal finished nearly 65% higher on central-bank buying, a global easing cycle and safe-haven demand [T6]. The current drawdown of 20.38% from the January 2026 high of EUR 4,688.32, against a +18.0% one-year return, is consistent with digestion rather than a regime break. The structural case rests on official-sector demand: the World Gold Council’s 2026 survey shows central banks accumulated an average of 1,000 tonnes per year over the past four years, roughly double the 500-tonne average of the preceding decade (calculation: 1,000 / 500 = 2.0x), and a record 45% of respondents expect their own reserves to increase over the next 12 months while only 1% expect a decrease [T7] [T8]. Société Générale remains strategically bullish, viewing gold as a hedge against monetary and policy uncertainty and arguing that much of the hawkish rates adjustment is already priced, limiting downside [T1]. The cyclical case is less clear: rising euro-area yields, unresolved real-yield pressure and the risk that central-bank demand slows at elevated prices cap near-term upside [T4] [T6]. Investors should treat current levels as a hold-and-accumulate zone on structural grounds, with tactical add-ons contingent on real yields rolling over.
Bullish Drivers
- Central-bank accumulation (structural, highest conviction): Average annual purchases of 1,000 tonnes over four years versus 500 tonnes in the prior decade; 95% of EMDE institutions cite geopolitical instability as a key allocation driver [T7] [T8].
- Reserve diversification and dedollarisation: SocGen cites dedollarisation trends and sovereign-debt concerns as providing a higher floor; WGC respondents rank diversification, inflation hedging and crisis performance as core motives, and 45% plan to raise their own reserves within 12 months [T1] [T8].
- Potential real-yield relief: UBS argues that if recent inflation pressure does not trigger broad second-round effects, the Fed may resume easing; softer US data, including a 0.6% drop in July retail sales, has already reduced tightening pressure, and Goldman Sachs called a September hike very unlikely [T2] [T3].
- ETF and investor flows: Inflows into gold-backed ETFs moderated sharply this year but remain positive, leaving room for re-acceleration if volatility or yields turn favourable [T1].
- Risk-off demand: Negative cross-asset risk sentiment and moderately negative equity momentum support defensive allocation, including in DACH markets which underperformed global peers over five days.
- EUR translation tailwind: EUR/USD weakness (-0.34% over five days, -1.50% year-to-date) mechanically supports XAU/EUR if USD gold holds steady; EUR weakness of 1% implies roughly +1% on the EUR quote, all else equal.
Relative Positioning vs Bitcoin and Ethereum
Direct Bitcoin and Ethereum price, return and volatility data are unavailable in this dataset; positioning is therefore framed with available aggregates and should be treated as indicative. Bitcoin dominance stands at 58.39% and total crypto market capitalisation at roughly EUR-quoted USD 2.31 trillion with 24h volume of USD 76.98 billion, indicating that capital concentration remains in Bitcoin rather than rotating broadly into higher-beta altcoins. Gold’s token proxy ranks 48 with EUR 122.90 million in 24h volume, several orders of magnitude below crypto aggregate turnover, reflecting gold’s different market structure rather than inferior relevance. Qualitatively, gold’s institutional role as a reserve asset, inflation hedge and geopolitical-risk hedge is validated by record central-bank survey participation and buying intentions [T7] [T8], while Bitcoin and Ethereum compete for the same debasement-hedge capital but with materially higher drawdown risk. With cross-asset risk sentiment negative, the defensive profile favours gold over high-beta digital assets on a risk-adjusted basis; in a renewed risk-on regime, relative attention could shift back toward crypto, but we cannot quantify that rotation without BTC and ETH return series.
Scenario Framework
Scenarios, not forecasts. Anchor: XAU/EUR 3,732.61, implied XAU/USD ~4,320.87, EUR/USD 1.1576, euro-area AAA 10Y 3.52%.
- Base (consolidation, probability-weighted core): Reserve demand and negative risk sentiment offset rising euro yields; XAU/EUR oscillates around current levels. Implied XAU/USD holds between the USD 4,200 consolidation threshold and the USD 4,500 200-day moving average, equivalent to roughly EUR 3,628 and EUR 3,887 at the current EUR/USD rate (calculation: 4,200 / 1.1576 = 3,628.16; 4,500 / 1.1576 = 3,887.35) [T2].
- Bull (real-yield relief): Fed expectations turn less hawkish, real yields fall, ETF flows re-accelerate and central-bank buying persists. A sustained break above USD 4,500 (about EUR 3,887) would likely draw momentum and ETF demand, opening the path toward retesting the EUR 4,688 high, which requires +25.60% from spot [T1] [T2] [T3].
- Bear (real yields and dollar rise together): Inflation or employment data revive hawkish pricing, pushing real yields and the USD higher simultaneously. A drop below USD 4,200 (about EUR 3,628) would confirm continued consolidation rather than a fresh bull leg; in EUR terms, a stronger euro would amplify the downside [T2] [T6].
- Stagflation (longer-horizon tail): Slower growth with persistent inflation is volatile near term but remains supportive for gold over the longer term, per ING’s framework; energy-driven inflation shocks that delay easing are the short-term risk within this path [T4].
Valuation Discussion
Gold has no cash flow, so conventional valuation metrics do not apply. The opportunity-cost lens dominates: with the euro-area AAA 10Y at 3.52% and rising, and US two-year yields above 4% per SocGen, the carry disadvantage versus duration is material [T1]. UBS explicitly links gold’s recent pressure to the rapid rise in real yields [T3]. However, SocGen argues the historical real-yield model has broken down post-2022: structural reserve demand has lifted the price floor, so elevated real rates no longer imply significantly lower prices [T1]. On positioning, spot is 20.38% below the January high but 195.00% above the dataset’s historical low, and the implied USD price of ~4,320.87 sits in the upper half of Saxo’s USD 4,200 to USD 4,500 consolidation band (EUR 3,628 to EUR 3,887 equivalent). Forex.com cautions that the 2026 backdrop is more finely balanced than 2025: much of the easing cycle is priced, and central-bank demand may be less relentless at elevated prices [T6]. Net assessment: gold is not cheap versus recent history, but the drawdown from ATH and the doubling of the official-sector accumulation rate argue against treating it as overextended. The 24-hour range of 1.71% of spot indicates contained near-term volatility. We would view a sustained break below the EUR 3,628 equivalent as a valuation reset signal, and strength above EUR 3,887 as confirmation that the structural floor is reasserting itself.
Risks
- Real-yield shock: Higher real yields remain the primary headwind; UBS and ING both identify this as the key cyclical risk [T3] [T4].
- Dollar and yields rising together: Saxo describes revived real yields plus dollar strength as the most challenging macro combination for gold [T2].
- More aggressive Fed response: SocGen notes a materially larger inflation shock and more aggressive Fed response would be needed for another major rates repricing; that scenario, while lower probability, is not zero [T1].
- Central-bank buying slowdown: ING flags that buying may slow; Forex.com notes demand may not be as relentless at elevated prices, and the WGC survey shows 55% of respondents expect no change or a decrease in their own reserves [T4] [T6] [T8].
- Profit-taking: After a ~65% 2025 rally, the market remains vulnerable to bouts of profit-taking [T4] [T6].
- False safe-haven signal: ING argues geopolitics alone is not enough; energy-driven inflation from geopolitical stress can delay easing and raise real yields, offsetting safe-haven demand [T4].
- EUR translation risk: XAU/EUR depends on both USD gold and EUR/USD; a sharp euro rally would compress the EUR quote even if USD gold is stable. The FX backdrop is mixed.
- Data-proxy risk: Market cap, supply, rank and volume refer to a tokenized gold proxy, not the physical bullion market; liquidity conclusions drawn from these figures are limited.
- Source-recency risk: Most cited items lack confirmed publication timestamps; time-sensitive claims should be re-verified before trading decisions.
Appendix
Methodology and Calculations
- Implied XAU/USD: 3,732.61 × 1.1576 = ~USD 4,320.87.
- USD-to-EUR level conversion: USD level / 1.1576. USD 4,200 → EUR 3,628.16; USD 4,500 → EUR 3,887.35.
- Drawdown from ATH: 3,732.61 / 4,688.32 – 1 = -20.38% (dataset value: -20.38494%).
- Upside to reclaim ATH: 4,688.32 / 3,732.61 – 1 = +25.60%.
- 24h range as % of spot: (3,762.40 – 3,698.44) / 3,732.61 = 63.96 / 3,732.61 = 1.71%.
- Position in 24h range: (3,732.61 – 3,698.44) / 63.96 = 53.4%.
- Euro-area curve slope: 3.5227% – 3.1276% = 39.5 bp (matches overview figure).
- Token turnover proxy: 122,897,299 / 1,615,988,361 = 7.61%.
- Central-bank accumulation acceleration: 1,000t / 500t = 2.0x prior-decade pace.
Data Limitations
Market cap, circulating supply, rank and volume are tokenized gold proxy (PAX Gold) metrics and do not describe the physical gold market. The bundle provides no direct real-yield, inflation breakeven, policy-rate futures or USD index series; those themes rely on cited source commentary. Euro-area yields cited are nominal AAA yields, not real yields. Bitcoin and Ethereum spot performance data are unavailable; only BTC dominance and crypto aggregates are provided. All forward-looking base, bull, bear and stagflation statements are scenarios, not forecasts.
Sources
- [T1] It’s time to get bullish on gold again, says SocGen | Kitco News: https://www.kitco.com/news/article/2026-09-03/its-time-get-bullish-gold-again-says-socgen
- [T2] ICYMI: ETF flows return to gold as Saxo flags 289-tonne central bank demand: https://investinglive.com/commodities/etf-flows-return-to-gold-as-saxo-flags-289-tonne-central-bank-demand
- [T3] Gold: Between inflation fears and diversification of reserves | UBS Global: https://www.ubs.com/global/en/wealthmanagement/insights/marketnews/article.3447284.html
- [T4] Geopolitics alone isn’t enough to lift gold | ING THINK: https://www.ing.com/articles/geopolitics-alone-isnt-enough-to-lift-gold
- [T5] Gold’s Dual Drivers: Central Bank Flows and Real Yields, According to Societe Generale | CryptoRank.io: https://cryptorank.io/news/feed/e43c1-gold-central-bank-flows-real-yields-societe-generale
- [T6] Gold 2026 Outlook: Fundamental XAU/USD analysis | Forex.com: https://www.forex.com/en-us/news-and-analysis/gold-2026-outlook-fundamental-xau-usd-analysis
- [T7] Central Bank Gold Purchases Hit 1,000t Average: WGC Survey | Mexico Business News: https://mexicobusiness.news/mining/news/central-bank-gold-purchases-hit-1000t-average-wgc-survey
- [T8] Central banks to increase gold reserves over next 12 months: WGC survey | The Hindu: https://www.thehindu.com/business/central-banks-to-increase-gold-reserves-over-next-12-months-wgc-survey/article71109776.ece
Compliance Notice
This report is AI-generated and provided for informational purposes only. It does not constitute investment advice, a recommendation, or an offer to buy or sell any financial instrument. Data is provided as of the timestamp stated and may be incomplete or inaccurate. Readers should conduct their own research and consult a licensed financial adviser before making investment decisions.
Important Note / Wichtiger Hinweis:
EN: This report may have been generated using AI. It processes data from publicly available sources. The content is provided for informational purposes only.DE: Dieser Bericht kann mithilfe von KI erstellt worden sein. Dabei werden Daten aus öffentlich zugänglichen Quellen verarbeitet. Die Inhalte dienen ausschließlich Informationszwecken.
* DE: Die ergänzenden Inhalte können KI-generiert sein. EN: The additional content may be AI-generated.