
Listen to the summary
Key Data Snapshot
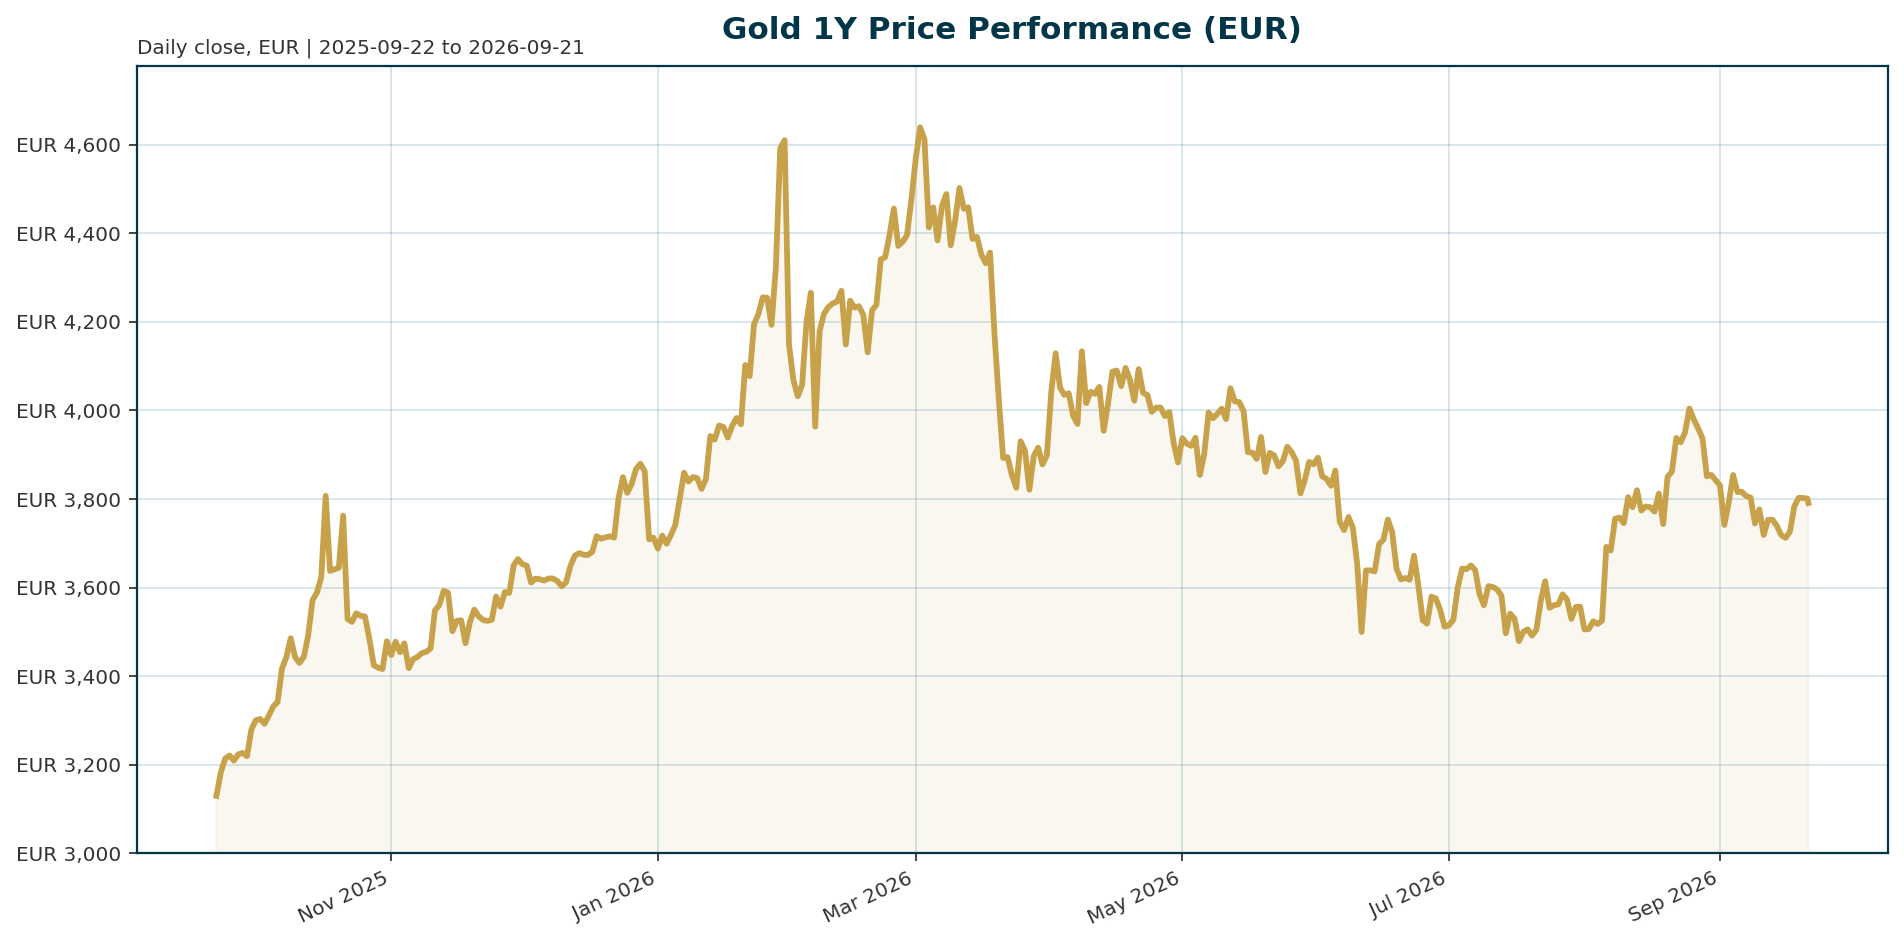
Gold (XAU) quoted in EUR trades at €3,793.35 as of 2026-09-21 04:54 UTC. Near-term momentum is flat to slightly negative, and the metal remains in a meaningful correction from its January 2026 high while preserving a double-digit one-year gain.
| Metric | Value | Interpretation |
|---|---|---|
| Price (XAU/EUR) | €3,793.35 | Near the lower end of the 24h range |
| 24h change | -0.13% | Mildly negative |
| 7d / 14d change | +0.4% / -1.2% | 7d gain does not offset 14d softness |
| 30d change | -5.2% | Active medium-term drawdown |
| 200d change | -16.3% | Correction from January highs still unresolved |
| 1y change | +18.1% | Structural uptrend intact |
| 24h range | €3,791.86 to €3,810.06 (€18.20, ~0.48% of spot) | Calculation: 3810.06 − 3791.86 = 18.20; 18.20 / 3793.35 × 100 ≈ 0.48% |
| All-time high | €4,688.32 (2026-01-28); spot −19.09% below (€894.97 distance) | Calculation: (3793.35 / 4688.32 − 1) × 100 ≈ −19.09% |
| All-time low | €1,265.28 (2019-11-17); spot +199.80% above | Calculation: (3793.35 / 1265.28 − 1) × 100 ≈ 199.80% |
| Proxy market cap / 24h volume | €1.65bn / €60.3m (turnover ~3.66%) | PAX Gold tokenized proxy, not the physical gold market |
| Circulating / total supply | 434,499.37 oz tokens (both); max supply: not applicable | Fully diluted valuation equals market cap |
Data caveat: market cap, supply, rank, and volume derive from the pax-gold Coingecko proxy. They describe the tokenized gold vehicle, not total above-ground gold.
Macro Backdrop
Cross-asset conditions are balanced rather than defensive: risk sentiment is neutral, equity momentum is moderately negative, the rates backdrop shows mixed euro yields with a flattening curve, and FX is mixed. DACH indicators average −0.01% over five days versus +1.22% for global equities, with the DAX the weakest five-day performer at −0.54% and the Nikkei 225 the strongest at +2.40%. The euro area AAA 10Y yield sits at 3.49%, down 3.5bp over five days, with a 10Y-2Y spread of 33.9bp. EUR/USD is 1.1493, down 0.15% over five days.
For gold specifically, ING argues that macro forces, not geopolitical headlines, are driving prices: real yields, the US dollar, and rate expectations are the binding constraints [T2]. The transmission channel runs from energy prices to inflation persistence to monetary policy: rising oil complicates the inflation outlook, delays easing, and keeps real yields elevated, which is a headwind for a non-yielding asset [T2]. The Federal Reserve left rates unchanged, with further easing conditional on clearer inflation progress, though ING’s US economist still expects two 25bp cuts later this year [T2]. Historically gold trades inversely to real yields because it generates no interest income [T4]. For EUR-based investors, local-currency returns also embed FX translation: a softer EUR/USD cushions XAU/EUR even when USD gold consolidates.
Investment Thesis
The thesis balances a cyclical headwind against a structural floor. Cyclically, elevated and potentially rising real yields raise the opportunity cost of holding gold, and the current 30-day decline of 5.2% reflects that pressure. Structurally, Société Générale describes a post-2022 regime shift in which gold trades near record highs despite positive real yields, breaking away from historical models that would imply significantly lower prices [T1]. The bank identifies sustained central-bank purchases, dedollarisation, geopolitical uncertainty, and sovereign debt concerns as providing a higher price floor, and it remains strategically bullish on gold as a hedge against monetary and policy uncertainty [T1]. SocGen frames the market as driven by two primary forces: central-bank flows and real yields [T3].
Supporting the structural leg, J.P. Morgan notes a record 43% of 73 global monetary authorities expect their own gold reserves to increase over the next year, with countries facing elevated geopolitical risk and sanctions exposure leading the accumulation [T4]. The base case is therefore that reserve diversification and fiscal credibility concerns keep XAU/EUR supported near current levels, with upside contingent on real yields rolling over and the current correction ending. The one-year gain of +18.1% despite the 30-day drawdown of −5.2% is consistent with a correction inside a broader structural trend rather than a trend reversal.
Bullish Drivers
- Central-bank reserve demand. Official-sector buying has become a dominant structural factor, absorbing supply and reducing gold’s sensitivity to short-term rate expectations [T3]. Emerging-market central banks are diversifying away from the US dollar after recent geopolitical shocks [T3], and nations seeking protection from sanctions risk are actively reducing dollar reserve exposure [T4].
- Monetary credibility and fiscal concerns. SocGen views gold as a hedge against monetary and policy uncertainty, with sovereign debt concerns among the structural supports [T1]. Lombard Odier adds that the macro context still favors real assets amid fiscal uncertainty and gradual erosion of purchasing power [T6].
- Potential real-yield relief. When real yields fall, the opportunity cost of holding a non-yielding asset declines and gold becomes more attractive relative to cash and bonds [T4]. Lombard Odier expects the Fed to stay on hold for much of 2026 with cuts more likely late in the year, limiting the higher-for-longer risk [T6]. ING’s economist expects two 25bp Fed cuts in September and December [T2].
- Stagflation optionality. A backdrop of slower growth alongside persistent inflation would remain supportive for gold over the longer term [T2].
- Local-currency tailwind. EUR/USD at 1.1493 is down 0.15% over five days; a modestly weaker euro translates into firmer XAU/EUR prints if USD gold is unchanged.
- Constructive dip-buying. ING expects deeper pullbacks to attract central-bank and longer-term buyers [T2].
Relative Positioning vs Bitcoin and Ethereum
Crypto-market context from the bundle: Bitcoin dominance is 58.15%, total crypto market cap is $2.44 trillion, and total 24h crypto volume is $72.2bn. This indicates a crypto market currently led by Bitcoin. However, the bundle provides no Bitcoin or Ethereum price, performance, or market-cap data, so a quantitative gold-versus-crypto return comparison cannot be made here. That limitation is explicit rather than assumed away.
Qualitatively, the two asset classes compete for different roles. Gold’s investment case rests on the absence of yield being offset by reserve-asset status, inflation hedging, and crisis demand; its attractiveness rises when investors seek defensive assets [T8]. Ethereum is a productive-asset bet on network activity and yields, with no official-sector demand base. In a monetary-credibility or sovereign-debt shock, gold’s reserve narrative is clearer; in a risk-on tape with elevated real yields, crypto beta may outperform tactically, though the missing performance data prevents validation. Within crypto, high BTC dominance suggests any tactical rotation would concentrate in Bitcoin rather than Ethereum. For a EUR-based allocator, XAU/EUR’s +18.1% one-year return with roughly 0.48% daily range width contrasts with crypto’s structurally higher volatility, supporting gold’s role as the portfolio’s stability sleeve.
Scenario Framework
| Scenario | Macro conditions | XAU/EUR implication |
|---|---|---|
| Base (most likely) | Neutral risk sentiment, curve flattening, Fed on hold with late-year cuts, central-bank buying continues, real yields elevated but not rising sharply [T6] | Range-bound to moderately constructive; structural demand offsets real-yield pressure; the −5.2% 30d drawdown stabilizes while the +18.1% 1y trend holds |
| Bull | One of three triggers per Crux Investor: dovish pivot before inflation is controlled, inflation moderates without aggressive hikes, or real yields fall on economic weakness [T7]; stagflationary mix also qualifies [T2] | Opportunity cost falls, capital rotates back into gold, and price re-rates toward the €4,688 ATH; a softer EUR/USD amplifies local-currency gains |
| Bear | Oil-driven inflation persists through mid-2026, the Fed, ECB, BoE, and BoJ maintain or extend tightening, and real yields stay elevated [T7]; ETF and jewellery demand soften [T6] | The drawdown extends; the 200d decline of −16.3% deepens and the structural floor gets tested |
| Tail | Sovereign reserve liquidation: the US, Germany, and Italy hold roughly 8,133, 3,350, and 2,451 tonnes respectively (Dec 2025); a forced sale would be a supply shock [T7] | The central-bank accumulation floor weakens materially; sharp downside repricing |
Crux Investor notes that none of the bull triggers is currently priced as the futures-market base case, which argues against front-loading cyclical exposure ahead of confirmation [T7].
Valuation Discussion
Gold has no cash flows, so valuation rests on opportunity cost, demand structure, and historical anchors. The opportunity-cost lens starts from real yields: falling real yields reduce the carry disadvantage of a non-yielding asset and mechanically support higher fair-value estimates [T4][T8]. The structural lens starts from SocGen’s regime-shift argument: traditional real-yield models would imply significantly lower prices than where gold trades, implying that reserve-demand scarcity and monetary credibility now justify a persistent valuation premium [T1]. Which lens dominates determines whether the current 19.09% discount to the ATH is cheap or merely fair.
Anchors in EUR terms: spot at €3,793.35 sits €894.97 below the €4,688.32 all-time high and €2,528.07 above the €1,265.28 all-time low. The narrow 24h range of €18.20 (~0.48% of spot) signals low immediate volatility, which SocGen notes improves gold’s appeal to longer-term reserve managers over short-term momentum traders [T1]. For EUR investors, valuation must include FX translation: EUR/USD at 1.1493 means roughly a 1% euro move alters local-currency gold returns by a similar magnitude independent of USD gold. A reasonable framework treats the €3,790 area as defended by structural demand, with re-rating potential toward the ATH conditional on real-yield relief, and downside risk toward the mid-€3,000s if the bear scenario materializes.
Risks
- Higher-for-longer real yields. A restrictive policy path keeps real yields elevated and caps gold upside [T2]. A sharp monetary-policy reversal producing rapidly rising real yields is the clearest headwind [T3].
- Tightening dominance over safe-haven demand. The oil-to-rates transmission channel (conflict lifts oil, oil sustains inflation, inflation forces tightening, tightening raises gold’s opportunity cost) is currently dominated by the tightening signal [T7].
- Demand-side erosion. Lombard Odier flags a prolonged ETF-demand decline and weaker physical demand such as jewellery as negative factors, even if partly offset by official buying [T6]. ETF inflows have already moderated sharply this year, though they remain positive [T1].
- Central-bank buying slowdown. ING cautions that official-sector support persists but buying may slow [T2].
- Sovereign liquidation tail risk. Forced sales by major reserve holders (US ~8,133t, Germany ~3,350t, Italy ~2,451t as of December 2025) would undermine the accumulation thesis [T7].
- Profit-taking after gains. Gold remains vulnerable to bouts of profit-taking after its year-to-date strength [T2].
- EUR strength. A sharp EUR/USD rally would drag EUR-denominated gold returns relative to USD gold.
- Data limitations. Real-yield time series, inflation expectations, ETF flow data, and central-bank purchase volumes are unavailable in this dataset; analysis relies on qualitative source views, several of which are analyst opinions rather than hard data.
On balance, the structural supports appear stronger than the cyclical headwinds, but the bear scenario is live and the market is not priced for it.
Appendix
Calculations
- 24h range: 3810.06 − 3791.86 = €18.20; as % of spot: 18.20 / 3793.35 × 100 ≈ 0.48%.
- ATH drawdown: (3793.35 / 4688.32 − 1) × 100 ≈ −19.09% (matches bundle ath_change_pct of −19.08922%).
- ATL gain: (3793.35 / 1265.28 − 1) × 100 ≈ +199.80% (matches bundle atl_change_pct).
- Distance to ATH: 4688.32 − 3793.35 = €894.97. Distance above ATL: 3793.35 − 1265.28 = €2,528.07.
- Proxy turnover: 60,333,944 / 1,648,216,486 ≈ 3.66%.
- Euro AAA yield curve: 2Y 3.148%, 5Y 3.239%, 10Y 3.488%, 30Y 3.750%. 10Y-2Y spread: 3.4875 − 3.1482 ≈ 33.9bp (matches overview). 10Y-30Y spread: 3.4875 − 3.7502 ≈ −26.3bp. 5Y-2Y spread: 3.2387 − 3.1482 ≈ 9.1bp, confirming curve flattening at the front end.
Data Caveats
- Market data sourced under coingecko_id pax-gold; market cap, supply, rank, and volume describe the tokenized proxy, not total physical gold.
- No real-yield series, inflation-expectation data, oil prices, DXY level, ETF flow series, or central-bank purchase volumes were provided; these are discussed qualitatively via cited analyst views.
- Ethereum is a listed benchmark asset, but no ETH market data was supplied; no ETH-specific quantitative claims are made.
- Bitcoin price and return data were not provided; only BTC dominance (58.15%) and crypto aggregates are available.
- Most Tavily source publication dates are unavailable; source timeliness is treated with caution. Views from SocGen, ING, J.P. Morgan, Lombard Odier, and Crux Investor are analyst opinions, not facts.
- Report generated 2026-09-21T04:54:47Z; market data retrieved 2026-09-21T04:54:35Z; market overview contained no errors.
Definitions
Real yield: an interest rate adjusted for inflation; the opportunity cost of holding a non-yielding asset such as gold [T8]. Dedollarisation: the reduction of US dollar exposure in official reserve portfolios in favor of alternatives including gold [T3]. Curve flattening: a narrowing gap between long- and short-term yields, observed here via the 10Y-2Y spread of 33.9bp versus a 1-month 2Y yield rise of +36.8bp against a 10Y rise of +19.9bp.
Sources
- [T1] It’s time to get bullish on gold again, says SocGen | Kitco News. https://www.kitco.com/news/article/2026-09-03/its-time-get-bullish-gold-again-says-socgen
- [T2] Geopolitics alone isn’t enough to lift gold | ING THINK. https://www.ing.com/articles/geopolitics-alone-isnt-enough-to-lift-gold
- [T3] Gold’s Dual Drivers: Central Bank Flows and Real Yields, According to Societe Generale | CryptoRank.io. https://cryptorank.io/news/feed/e43c1-gold-central-bank-flows-real-yields-societe-generale
- [T4] Is it a golden era for gold? | J.P. Morgan Private Bank U.S. https://privatebank.jpmorgan.com/nam/en/insights/markets-and-investing/is-it-a-golden-era-for-gold
- [T5] 7 Reasons Gold and Silver Will Surge From Current Levels | GoldSilver.com. https://goldsilver.com/industry-news/article/7-reasons-gold-and-silver-will-surge-from-current-levels
- [T6] Gold’s slowdown doesn’t signal a reversal | Lombard Odier. https://www.lombardodier.com/insights/2026/may/gold-s-slowdown.html
- [T7] Gold Declined 10% Over Two Weeks on Rising Oil Prices and Interest Rate Pressure | Crux Investor. https://www.cruxinvestor.com/posts/gold-declined-10-over-two-weeks-on-rising-oil-prices-and-interest-rate-pressure-is-the-safe-haven-case-still-valid
- [T8] What Affects Gold Prices? 6 Key Factors Explained | XTB. https://www.xtb.com/en/education/what-affects-gold-prices-6-key-factors-explained
Disclaimer
This report is AI-generated and is provided for informational purposes only. It does not constitute investment advice, a recommendation, or an offer to buy or sell any financial instrument. Data may be incomplete, delayed, or derived from third-party sources whose accuracy is not guaranteed. Readers should conduct their own research and consult a licensed financial advisor before making any investment decision.
Important Note / Wichtiger Hinweis:
EN: This report may have been generated using AI. It processes data from publicly available sources. The content is provided for informational purposes only.DE: Dieser Bericht kann mithilfe von KI erstellt worden sein. Dabei werden Daten aus öffentlich zugänglichen Quellen verarbeitet. Die Inhalte dienen ausschließlich Informationszwecken.
* DE: Die ergänzenden Inhalte können KI-generiert sein. EN: The additional content may be AI-generated.