
The altii-Gold-Report: Gold (XAU) in EUR
Date: 5 October 2026. Quote asset: EUR. Data as of 04:20 UTC.
Watch the video
This player shows only the Gold chapter of the daily altii market briefing. Watch the full video on tube.altii.de.
Key Data Snapshot
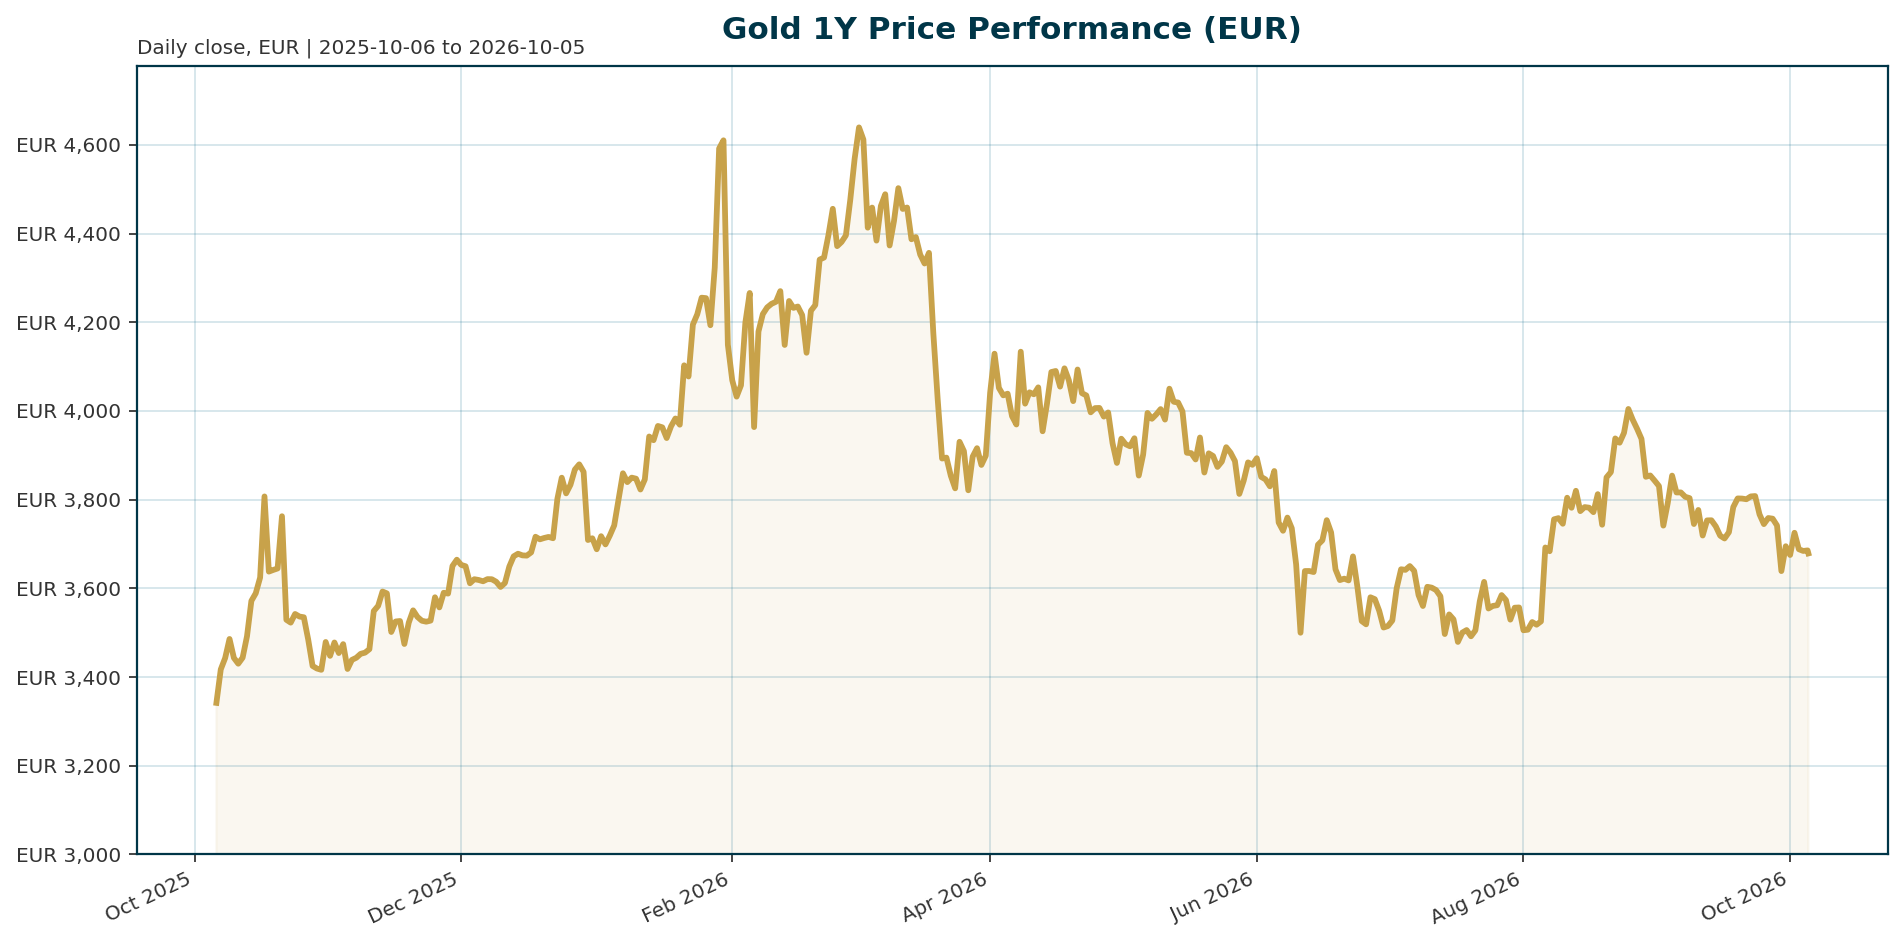
| Metric | Value | Change |
|---|---|---|
| Price (EUR) | 3,708.54 | +0.67% (24h) |
| 24h range | 3,707.14 to 3,732.33 | unavailable for intraday timing |
| 7d / 14d | −1.14% / −4.66% | short-term correction |
| 30d / 200d | −6.36% / −14.34% | medium-term downtrend |
| 1-year | +6.45% | positive trend year intact |
| ATH (EUR) | 4,688.32 (28 Jan 2026) | −20.90% from peak |
| ATL (EUR) | 1,265.28 (17 Nov 2019) | +193.10% |
| PAXG market cap / volume | 1.613bn EUR / 59.55m EUR | token float only, see Risks |
| Euro AAA 10Y yield | 3.59% | −2.3bp (5d), +64.4bp YTD |
| Euro AAA 10Y-2Y spread | 48.6bp | curve steepening |
| EUR/USD | 1.1285 | −0.38% (5d), −3.96% YTD |
| BTC dominance | 59.28% | crypto risk concentrated |
Drawdown math: 3,708.54 / 4,688.32 − 1 = −20.90%. Recovery needed back to the record: 4,688.32 / 3,708.54 − 1 = +26.41%. Supply reconciliation: 435,049.88 units × 3,708.54 EUR = 1.6134bn EUR, matching the reported market cap. Implied USD spot cross-check: 3,708.54 × 1.1285 = approximately 4,185 USD/oz, consistent with reporting that gold trades above $4,000 per ounce [T8].
If the 24h bounce (+0.67%) fails at the 3,730 area, the 30-day downtrend (−6.36%) remains the operative path.
Macro Backdrop
Risk sentiment reads neutral and equity momentum is mixed, with DACH indices lagging global peers: DACH indicators average −2.38% over five days versus +1.35% for global equity indicators, the ATX the weakest major performer at −4.19% while the Nikkei 225 leads at +6.50%. The rates backdrop is one of mixed euro yields with curve steepening: the euro-area AAA 10Y sits at 3.59% (−2.3bp over five days but +64.4bp year to date), the 2Y at 3.11% (−14.5bp over five days, +99.8bp YTD), and the 10Y-2Y spread at 48.6bp. The FX backdrop is mixed, with EUR/USD at 1.1285 (−0.38% over five days, −3.96% YTD), meaning some of gold’s EUR-quoted performance is an FX story rather than a pure gold story. This market overview is subordinate to the gold analysis below.
The dominant global tension is the Fed regime. Markets have shifted from pricing additional easing to debating whether the Federal Reserve raises rates once or twice more, pushing the 2Y Treasury yield back above 4% and supporting the US dollar [T1]. SocGen argues inflation risks remain underpriced because even expected hikes would not align policy with the Atlanta Fed’s Taylor Rule model [T1]. ING flags rising energy prices as a complicating factor for the inflation outlook, keeping real yields elevated in a higher-for-longer environment; the Fed held rates with Powell demanding clearer inflation progress, though ING’s economist still expected two 25bp cuts later in the year (a view that may predate the current hawkish repricing) [T2]. On the monetary side, US M2 money supply is running at roughly 5.7% year-on-year growth as of October 2026 [T8]. The debt context frames the structural backdrop: public debt-to-GDP in many advanced economies sits at or near post-war highs, historically resolved through financial repression, inflation, or currency depreciation, all favorable for gold [T4].
Investment Thesis
The core argument: gold has decoupled from the historical real-yield opportunity-cost model. Despite persistently positive real yields, gold has continued to trade near record highs, breaking away from historical models that would imply significantly lower prices; SocGen calls this a clear post-2022 regime shift driven by sustained central bank purchases, dedollarisation trends, geopolitical uncertainty, and sovereign debt concerns that create a higher price floor [T1]. The two horizons must not be conflated: over the next 6 to 12 months, elevated yields and a firm dollar are genuine obstacles, while over the multi-year horizon structural demand reasserts itself through yield stress rather than capitulating to it [T8].
The structural anchor is official-sector demand. Central banks accumulated an average of 1,000t over the past four years versus roughly 500t annually in the prior decade, with 2026 buying projected at approximately 850t, a third straight year of elevated purchases [T5] [T8]. Sentiment confirms intent: a record 43% of surveyed monetary authorities expect their own gold reserves to increase over the next year [T6], and 95% of central banks expect to increase holdings overall with 44% now managing gold actively [T3]. Reserve managers increasingly hold more gold than Treasuries, seeking insulation from sanctions risk and currency weaponization [T4]. The debt regime closes the loop: with advanced-economy leverage at post-war extremes, the historical resolution toolkit of financial repression and inflation favors gold holders [T4], and academic proposals to back central bank balance sheets with real assets underline how the reserve-asset debate has returned to mainstream discussion [T7].
Base case: gold consolidates in a 3,500 to 3,900 EUR range while central bank accumulation near 850t absorbs yield-driven ETF weakness. The structural bull case requires a negative-real-rate or financial-repression turn; the structural bear case requires both a deceleration in reserve buying and a larger inflation shock forcing aggressive tightening.
Bullish Drivers
- Official-sector floor: 1,000t four-year purchase average versus 500t in the prior decade, roughly 850t projected for 2026, and record survey participation of 76 central banks, the highest in the survey’s nine-year history [T5].
- Survey internals: 92% of participants cite interest rate levels as a decision factor, 90% cite gold’s crisis performance (survey conducted 5 February to 19 May 2026, capturing sentiment after the Middle East escalation), and 95% of EMDE institutions view geopolitical instability as a key allocation driver versus 67% in advanced economies [T5].
- ETF flows recovering: global gold ETF holdings reached a record 4,189 tonnes; the June outflow of −74t showed yield pressure can trigger selling, but the September recovery of +121t marks a +195t swing in three months, roughly 23% of the projected 850t annual central bank purchase volume [T8].
- Monetary expansion: US M2 growth of approximately 5.7% y/y provides a supportive (though not sufficient) monetary backdrop [T8]; SocGen notes ETF inflows moderated but remain positive, and lower volatility improves gold’s appeal to longer-term reserve managers [T1].
- Hedge demand: the Taylor Rule gap suggests policy is not yet restrictive enough for the inflation path, supporting gold as a hedge against monetary and policy uncertainty [T1]; a stagflationary mix of slower growth and persistent inflation is historically supportive over the longer term [T2].
- Pullback buyers: ING argues deeper pullbacks would likely attract central bank and longer-term investor buying, which matters now that gold in EUR is −14.34% over 200 days [T2].
If ETF flows sustain the September +121t pace, investor demand compounds the official-sector floor and accelerates mean reversion from the −20.90% drawdown. If geopolitical escalation in the Middle East re-intensifies, crisis-hedge demand among EMDE reserve managers rises disproportionately [T5].
Relative Positioning vs Bitcoin and Ethereum
Total crypto market capitalization stands at 2.61trn USD with BTC dominance at 59.28%, signaling speculative capital is concentrated in Bitcoin rather than broadening into alternatives including ETH. Total crypto 24h volume of 51.83bn USD dwarfs the 59.55m EUR daily turnover of the gold token used here as a price proxy, an orders-of-magnitude difference in liquidity depth and turnover profile. Ethereum-specific pricing data is unavailable in this dataset, so the comparison stays structural rather than price-based.
The contrast is deliberate in portfolios. Gold’s 1-year EUR return of +6.45% comes with a −20.90% drawdown from its EUR record, a mild profile versus crypto’s historically deeper drawdown cycles. Gold yields nothing but carries official-sector reserve demand and sanctions resilience with no analogue in crypto, given central bank traceability concerns [T4]. ETH offers staking yield and smart-contract exposure but carries technology and regulatory risk. If BTC dominance keeps rising, speculative capital stays concentrated in Bitcoin and gold’s low-beta diversification pitch strengthens for euro-area allocators. In the current neutral risk-sentiment regime, gold competes favorably with ETH’s higher-volatility risk profile. Bearish framing: in a renewed risk-on melt-up, gold’s flat 24h-volume and low beta would lag crypto badly; gold is a portfolio ballast, not a momentum vehicle.
Scenario Framework
Triggers to monitor: the Fed path (hike, hold, or cut), the 2Y Treasury level (currently above 4%) [T1], EUR/USD direction (1.1285), real-yield trajectory, ETF flow momentum (+121t in September versus −74t in June) [T8], and the central bank purchase run-rate (approximately 850t projected for 2026) [T8].
- Bullish scenario: the Fed pivots to cuts or inflation undershoots, real yields fall, and EUR-quoted gold reclaims the 4,000+ area. Confirmation: sustained ETF inflows above 100t per month plus continued official buying. SocGen’s view supports this: with much of the hawkish adjustment already reflected in markets, downside risk for gold appears increasingly limited [T1].
- Base scenario: hawkish hold with range-bound trading between 3,400 and 3,900 EUR. Central bank demand near 850t and stabilizing ETF flows offset elevated real yields; EUR/USD drift materially affects EUR-quoted returns given the −3.96% YTD euro move.
- Bearish scenario: a renewed inflation shock forces aggressive Fed hikes beyond current pricing, the 2Y pushes materially above 4%, the USD strengthens, and ETF outflows exceed June’s −74t pace. Gold breaks below 3,400 EUR toward deeper correction levels. ING warns a higher-for-longer real yield environment is a genuine headwind and macro forces, not geopolitics alone, drive prices [T2].
Qualitative probabilities: the base case is the most likely path given the Fed’s current stance; the bullish case requires a policy pivot that current pricing does not embed; the bearish case requires a larger shock that SocGen considers unlikely without materially higher inflation [T1].
Valuation Discussion
Gold produces no cash flow, so valuation rests on opportunity cost, monetary aggregates, and flows. The anchors: the current 3,708.54 EUR price is −20.90% below the January 2026 record of 4,688.32 EUR and +193.10% above the 2019 low of 1,265.28 EUR. The implied USD spot of approximately 4,185 USD/oz sits above the $4,000 threshold cited in current commentary [T8].
The historical model has broken down. Real yields rose from deeply negative territory to the highest levels since the 2008 financial crisis, yet gold posted a +13% return in 2023 to a record, showing the inverse real-yield relationship has been inoperative for extended periods [T6]. The M2 framework adds nuance: money growth of 5.7% y/y is necessary but not sufficient for sustained gold appreciation; it needs suppressed real yields and rising inflation expectations alongside it, and the 1980s counterexample (nominal yields rising alongside gold appreciation) warns against a single-variable view [T8]. SocGen’s regime-shift argument implies model-implied fair value sits below spot, meaning gold carries a structural premium the market pays for reserve demand and debt-regime hedging [T1]. Two-sided reading: if a policy shock re-couples gold to real yields, that premium unwinds and model fair value falls materially below spot; if the post-2022 structural floor holds, the current −20.90% drawdown reads as a correction within an uptrend rather than a valuation excess.
Risks
- Real-yield headwind: a higher-for-longer Fed path with a firm dollar is the primary tactical risk; the 2Y above 4% is an already-realized headwind [T1] [T2].
- Profit-taking: gold remains up roughly 6% year to date in USD terms, leaving the market vulnerable to bouts of profit-taking [T2].
- ETF reversal: June’s −74t outflow demonstrates yield pressure can trigger near-term selling at scale [T8].
- Central bank deceleration: ING warns official buying may slow; a drop below the roughly 850t projection would remove the structural floor [T2] [T8].
- Geopolitical paradox: tensions lift energy prices, which can keep real yields elevated; geopolitics alone is insufficient to lift gold [T2].
- Data-quality caveats: this report prices gold in EUR via the PAXG tokenized-gold proxy; the 1.61bn EUR market cap and 59.55m EUR volume reflect the token float only, not the global gold market, and token premium or discount plus thin volume can distort intraday moves versus physical spot. EUR-terms returns conflate gold’s USD move with EUR/USD dynamics (−3.96% YTD), so the FX decomposition is directional only. News items lack publication dates, and the Fed-path narratives across sources (ING expecting cuts versus markets debating hikes) may be from different periods and are treated here as contested. The approximately 850t purchase projection and M2 figures come from an educational source, not official WGC data, and are attributed cautiously [T8].
Appendix
Performance Ladder (EUR)
1h: +0.04%. 24h: +0.67%. 7d: −1.14%. 14d: −4.66%. 30d: −6.36%. 200d: −14.34%. 1y: +6.45%. 24h high 3,732.33, low 3,707.14. ATH 4,688.32 (28 Jan 2026, −20.90%). ATL 1,265.28 (17 Nov 2019, +193.10%).
Euro-Area AAA Yield Curve
| Tenor | Yield | 5d (bp) | 1m (bp) | YTD (bp) |
|---|---|---|---|---|
| 2Y | 3.11% | −14.5 | +23.0 | +99.8 |
| 5Y | 3.27% | −10.9 | +24.3 | +82.8 |
| 10Y | 3.59% | −2.3 | +23.7 | +64.4 |
| 30Y | 3.84% | +4.8 | +4.8 | +35.6 |
Spread decomposition: 10Y-2Y = 3.592% − 3.106% = 48.6bp. YTD steepening asymmetry: 2Y +99.8bp versus 30Y +35.6bp, with the 30Y roughly flat over one month.
FX and Equities
EUR/USD 1.1285 (−0.38% 5d, −2.92% 1m, −3.96% YTD); EUR/GBP 0.85249 (−0.22% 5d); EUR/CHF 0.93647 (−0.90% 5d); EUR/JPY 178.18 (−0.31% 5d). DAX 25,231 (−0.56% 5d, +3.02% YTD); ATX 6,718 (−4.19% 5d, +26.38% YTD); Euro Stoxx 50 6,249 (−1.50% 5d, +7.81% YTD); S&P 500 7,723 (+0.51% 5d, +12.81% YTD); Nasdaq 27,191 (+1.38% 5d, +16.99% YTD); Nikkei 225 69,737 (+6.50% 5d, +38.53% YTD); Hang Seng 23,909 (−2.98% 5d, −6.72% YTD).
Methodology Notes
Gold is quoted in EUR via the PAXG tokenized-gold proxy (coingecko_id: pax-gold) with a circulating supply of 435,049.88 units. Market cap of 1.613bn EUR reflects the token float, not total above-ground gold. Max supply is not applicable to physical gold but is reported as null in the token dataset. Real-yield analysis relies on nominal AAA yields plus qualitative source claims because euro-area breakeven inflation data is unavailable in this dataset. Ethereum-specific price and staking data is unavailable, keeping the crypto comparison structural. T7 is used as thematic color on the reserve-asset debate, not as a market fact.
Sources
- [T1] It’s time to get bullish on gold again, says SocGen | Kitco News. https://www.kitco.com/news/article/2026-09-03/its-time-get-bullish-gold-again-says-socgen
- [T2] Geopolitics alone isn’t enough to lift gold | ING THINK. https://www.ing.com/articles/geopolitics-alone-isnt-enough-to-lift-gold
- [T3] Geopolitical Determinants of Global Gold demand | FutureUAE. https://futureuae.com/rss/Mainpage/Report/10575
- [T4] Report: Central Banks Now Hold More Gold Than Treasuries | CEOWORLD magazine. https://ceoworld.biz/2026/06/15/report-central-banks-now-hold-more-gold-than-treasuries-what-that-means-for-global-capital-and-currencies
- [T5] Central Bank Gold Purchases Hit 1,000t Average: WGC Survey | Mexico Business News. https://mexicobusiness.news/mining/news/central-bank-gold-purchases-hit-1000t-average-wgc-survey
- [T6] Is it a golden era for gold? | J.P. Morgan Private Bank. https://privatebank.jpmorgan.com/nam/en/insights/markets-and-investing/is-it-a-golden-era-for-gold
- [T7] An Inflation-Protected Balance Sheet | John H. Cochrane, The Grumpy Economist. https://www.grumpy-economist.com/p/an-inflation-protected-balance-sheet
- [T8] Gold Price Prediction: 3 Frameworks for $4,000 and Beyond | Discovery Alert. https://discoveryalert.com/education/gold-price-prediction-frameworks
Disclaimer
This report is AI-generated and for informational purposes only. It does not constitute investment advice, a recommendation, or an offer to buy or sell any security or asset. Data may contain errors or be delayed, and readers should verify all figures independently before making investment decisions.
Important Note / Wichtiger Hinweis:
EN: This report may have been generated using AI. It processes data from publicly available sources. The content is provided for informational purposes only.DE: Dieser Bericht kann mithilfe von KI erstellt worden sein. Dabei werden Daten aus öffentlich zugänglichen Quellen verarbeitet. Die Inhalte dienen ausschließlich Informationszwecken.
* DE: Die ergänzenden Inhalte können KI-generiert sein. EN: The additional content may be AI-generated.