
Watch the video
This player shows only the Gold chapter of the daily altii market briefing. Watch the full video on tube.altii.de.
Key Data Snapshot
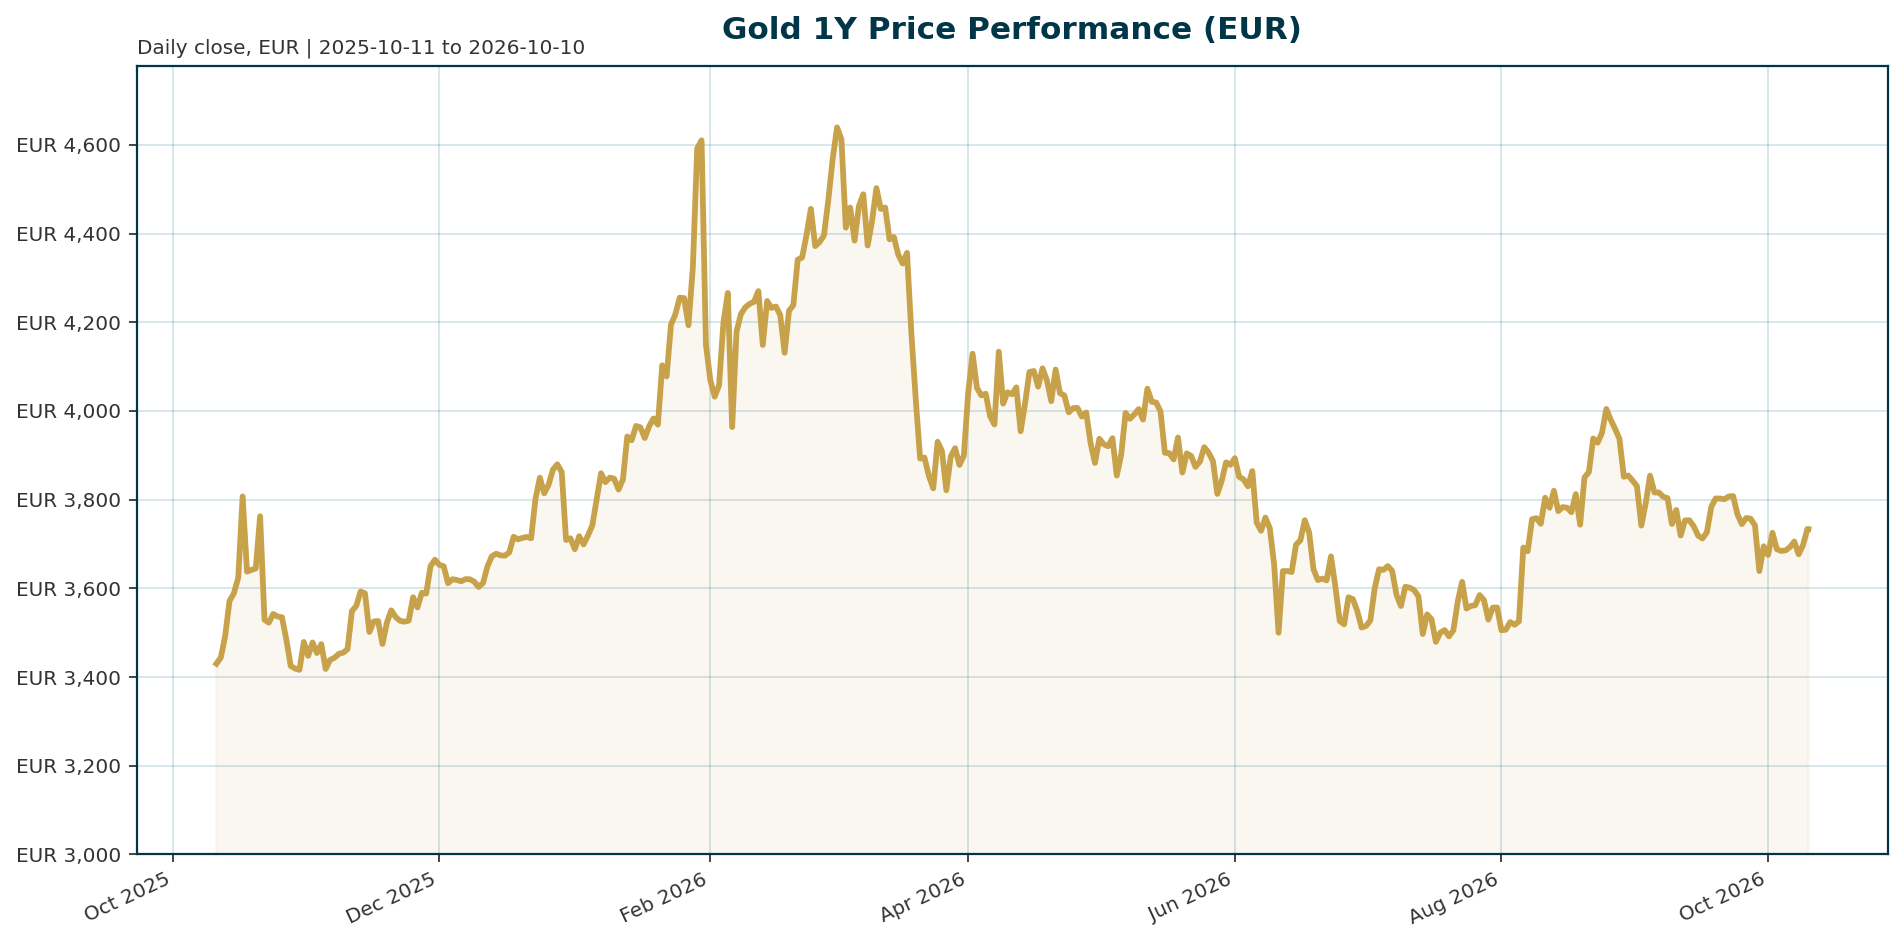
| Metric | Value | Detail |
|---|---|---|
| Gold spot (XAU/EUR) | EUR 3,734.12 | Retrieved 2026-10-10 04:52 UTC |
| 24h range | EUR 3,720.92 to EUR 3,749.50 | Range EUR 28.58, i.e. 0.77% of spot (28.58 / 3,734.12 = 0.77%) |
| Performance 1h / 24h / 7d | +0.11% / +0.42% / +0.83% | Short-term momentum stabilising |
| Performance 14d / 30d / 200d | -2.30% / -5.29% / -4.14% | Medium-term drawdown |
| Performance 1y | +4.85% | Positive annual return intact |
| All-time high | EUR 4,688.32 (2026-01-28) | Spot is 20.35% below ATH |
| All-time low | EUR 1,265.28 (2019-11-17) | Spot is 195.12% above ATL |
| Euro Area AAA 10Y yield | 3.5192% | +5.52 bp over 5d, +14.07 bp over 1m (as of 2026-10-08) |
| Euro Area AAA 2Y yield | 3.0331% | 10Y-2Y spread 48.6 bp |
| Euro Area AAA 30Y yield | 3.7782% | 30Y-10Y segment: 25.9 bp |
| EUR/USD | 1.1216 | -0.20% over 5d, -3.60% over 1m, -4.54% YTD |
| Proxy instrument market cap | EUR 1.6409 bn | Tokenised gold proxy (PAXG), not the full bullion market |
| Proxy instrument 24h volume | EUR 131.76 mn | Volume/market-cap ratio: 8.03% (131,760,624 / 1,640,902,337) |
| BTC dominance / total crypto market cap | 59.11% / EUR 2.5021 tn | Aggregate crypto context |
Calculation notes. ATH drawdown check: 3,734.12 / 4,688.32 minus 1 = -20.35%, consistent with the reported -20.3526%. Upside required to regain ATH: 4,688.32 / 3,734.12 minus 1 = +25.55%. Implied USD gold price via FX translation: 3,734.12 × 1.1216 = approximately USD 4,188 per troy ounce, consistent with reported USD prices above USD 4,000 [T1]. Curve reconciliation: 10Y 3.5192% minus 2Y 3.0331% = 48.6 bp, matching the reported spread. The market cap, supply (439,434.57 tokens), and rank (54) describe the tokenised proxy instrument, not global gold market size.
Macro Backdrop
The cross-asset backdrop is neutral and unpolarised. Risk sentiment is neutral, equity momentum is mixed, and the rates backdrop shows euro yields moving sideways to higher. DACH equity indicators average -1.83% over five days versus -0.13% for global equity indicators, with the ATX the weakest performer at -3.00% over five days. The Euro Area AAA 10Y yield stands at 3.52% after a 5.5 bp five-day move, and the 10Y-2Y spread sits at 48.6 bp, a mildly positive curve. EUR/USD is 1.1216, essentially flat over five days at -0.20% but down 3.60% over one month, indicating mixed FX conditions with recent euro softness. This backdrop matters for gold less as a crisis signal and more as a rates-and-currency translation environment for a euro-based allocator.
The gold-specific macro picture is more contested. The Federal Reserve, ECB, and Bank of Japan have all raised policy rates in response to persistent inflation pressures and renewed Middle East uncertainty, and higher real yields raise the opportunity cost of holding non-yielding bullion [T8]. Bundesbank President Nagel defended ECB hikes of 25 basis points in both June and September and flagged oil prices rising from roughly USD 70 before the summer to above USD 100, an external supply shock monetary policy cannot reverse but must prevent from embedding in wages and expectations [T1] [T8]. At the same time, the traditional inverse relationship between gold and real yields has repeatedly broken down over the past two years, with gold resilient even as real yields reached post-2008 highs [T3]. Lombard Odier notes this link has partially re-asserted itself recently, but argues the Fed is likely to hold policy rates for much of 2026, limiting the downside from the rates channel [T6].
Investment Thesis
The institutional case for gold in EUR terms rests on a deliberate tension. Tactically, gold faces a genuine headwind: euro nominal yields have risen over the past month (10Y +14.07 bp) and real yields are elevated globally. Strategically, the asset is supported by the strongest structural demand force in the source set, namely official-sector accumulation. The World Gold Council reports central banks bought an average of 1,000 tonnes per year over the past four years, double the 500-tonne average of the preceding decade [T2] [T7]. In the 2026 WGC survey of 76 central banks, the highest participation on record, 89% of respondents expect global central bank gold reserves to rise over the next 12 months and a record 45% expect their own reserves to increase, with only 1% expecting a decrease [T7].
The motivation behind this buying is regime-level, not price-level. Reserve managers cite crisis performance, portfolio diversification, inflation hedging, geopolitical risk, and reserve diversification policy as key drivers [T7]. J.P. Morgan notes that countries not allied with the United States are reducing dollar dependence to make reserves less vulnerable to sanctions [T3]. Bundesbank President Nagel disclosed that gold’s share of global central bank reserves has risen from roughly 14% in 2023 to nearly 25%, and institutions at the LBMA conference argued gold’s pricing logic is re-anchoring around unsustainable debt burdens, persistent inflation, and fiat purchasing-power concerns [T1]. For a EUR allocator the thesis is therefore: hold gold as a reserve-quality diversifier and purchasing-power hedge, size it tactically around real-yield and EUR/USD risk, and accept that the metal may underperform opportunistically in a high-real-rate environment even while its strategic rationale strengthens.
Bullish Drivers
1. Persistent, price-insensitive official-sector demand. Central bank accumulation averaging 1,000 tonnes per year over four years versus 500 tonnes previously is the anchor of the bull case [T2] [T7]. With 92% of surveyed institutions flagging interest-rate levels as relevant but 90% citing gold’s crisis performance as highly relevant, this demand base appears motivated by risk management rather than yield sensitivity, and 95% of EMDE institutions view geopolitical instability as a key allocation driver versus 67% in advanced economies [T2].
2. Reserve-share expansion and storage repositioning. Gold’s share of global central bank reserves has climbed from roughly 14% in 2023 to nearly 25%, and the Dutch central bank moved approximately 86 tonnes from the United States and Canada to London between March and August 2026 as crisis preparedness, making London its largest storage location at 32.1% [T1]. Storage relocation signals that reserve managers treat physical accessibility, not just ownership, as a risk factor.
3. Inflation and energy-shock dynamics. Oil above USD 100 following the US-Iran conflict, combined with Nagel’s warnings on energy inventories, refining capacity, and fertilizer shortages, sustains the inflation narrative that underpins gold demand for the foreseeable future [T1] [T8].
4. Fiat-debasement and fiscal concerns. Participants at the LBMA conference identified unsustainable global debt, persistent inflation, and fiat purchasing-power erosion as drivers of increased gold allocations, and Lombard Odier similarly frames fiscal uncertainty and gradual purchasing-power erosion as supportive for real assets [T1] [T6].
5. Resilience against the rates channel. Gold held above USD 4,000 per ounce even with US Treasury yields above 5%, evidence that the debasement and reserve-demand channels can dominate the opportunity-cost channel, at least episodically [T1] [T3]. WisdomTree also notes central banks added a reported net 23 tonnes in its recent monthly window, consistent with continued flow support [T4].
Relative Positioning vs Bitcoin and Ethereum
The bundle provides only aggregate crypto context: BTC dominance at 59.11%, total crypto market capitalisation at EUR 2.5021 trillion, and total 24h crypto volume at EUR 63.2937 billion. No Bitcoin or Ethereum price series, return, volatility, or correlation data are supplied, so direct gold-versus-crypto performance comparisons are not possible here and any precise claim would be unsupported.
Qualitatively, the positioning contrast is clear. Gold’s documented demand base is sovereign: central banks, reserve diversification policy, crisis liquidity, and sanction-resistance [T7] [T3]. Crypto assets occupy the opposite end of the institutional spectrum: higher beta, no official-sector bid, and sensitivity to global liquidity conditions. In a risk-off or policy-credibility stress scenario, gold’s central-bank floor and physical-market depth likely make it the more reliable reserve hedge. In a liquidity-driven risk-on environment, Bitcoin and Ethereum could plausibly outperform, but this cannot be evidenced from the current bundle. Against the crypto aggregate: gold’s EUR 1.64 bn proxy market cap is negligible relative to the EUR 2.50 tn crypto market, but that comparison is instrument-level, not representative of the physical gold market, which is orders of magnitude larger and therefore structurally deeper and more liquid than any crypto market in crisis conditions.
Scenario Framework
Base case: consolidation (probability-weighted central). Gold trades range-bound in EUR terms near EUR 3,700 to 3,750. Official-sector buying [T7] and euro softness (EUR/USD -3.60% over 1m) cushion downside, while elevated euro yields (10Y at 3.52%) cap upside. The 30d return of -5.29% against a 1y return of +4.85% describes consolidation, not trend reversal. Watch the 10Y yield path and EUR/USD for direction.
Bull case: re-anchoring regime. Inflation expectations stay sticky on energy shocks [T1] [T8], policy credibility erodes, EUR/USD stays soft, and reserve accumulation continues at 1,000-tonne pace. Gold’s yield-insensitive demand base dominates, and the market moves toward retesting the EUR 4,688 ATH, which requires +25.55% from spot. The weakening correlation with bond yields observed at the LBMA conference [T1] is the key enabler.
Bear case: real-yield reassertion. Real yields rise persistently as central banks restore credibility, USD strength tightens global financial conditions, ETF and private demand decline, and physical demand such as jewellery softens [T6] [T8]. Central-bank buying remains but proves insufficient against private outflows. The 20.35% ATH discount widens; support layers form near the 200d change (-4.14%) zone and below.
Alternative case: correlation instability. The relationship between gold and yields remains unstable because reserve diversification and debasement concerns intermittently offset the opportunity-cost channel [T1] [T3] [T6]. In this regime, standard rates-based gold models systematically under- or over-predict, and scenario risk widens in both directions.
Valuation Discussion
Gold has no cash flows, so valuation must be triangulated through opportunity cost, FX translation, and demand structure rather than discounted cash flow.
Opportunity cost. With the euro 10Y AAA yield at 3.52% and the 2Y at 3.03%, the nominal carry sacrifice of holding gold is materially higher than in the pre-2022 regime. J.P. Morgan’s framework treats real yields as the opportunity cost of holding gold, but also documents that this relationship broke down over the past two years, with gold posting a +13% return in 2023 and record highs despite real yields at post-2008 levels [T3]. A pure real-yield model would currently argue for gold materially below spot; the observed price behaviour argues the model is incomplete.
Price structure. At EUR 3,734.12, gold sits 20.35% below its January 2026 ATH of EUR 4,688.32 and 195.12% above its November 2019 ATL of EUR 1,265.28. This is a discount to the recent cycle peak, not a distressed valuation. The +25.55% recovery requirement to reach ATH implies a substantial re-anchoring premium would need to re-emerge. Implied FX translation places the metal at approximately USD 4,188 per ounce, above the USD 4,000 level institutions flagged as a key psychological floor [T1].
Structural premium debate. If the market assigns a higher and persistent premium to reserve diversification, sanction risk, and debasement protection, the historical real-yield model will understate fair value [T1] [T3]. If instead real yields reassert dominance and official-sector demand slows, the ATH discount widens. Our base assessment: current levels represent fair value within a consolidation regime, with the balance of evidence modestly favouring the structural-premium interpretation given the documented doubling of official-sector demand [T2] [T7], while acknowledging this premium is unverifiable with precision from available data.
Risks
Real-yield and policy risk. Higher interest rates and real yields directly increase the opportunity cost of holding non-yielding bullion, and a stronger USD associated with higher US rates adds pressure [T8]. As one market commentator cautions, gold is not simply a hedge against inflation, war, or government debt; if inflation forces central banks to tighten, real yields can rise and gold can suffer [T5].
Demand-composition risk. Lombard Odier identifies higher-for-longer real yields, a prolonged decline in ETF demand, and weaker physical demand such as jewellery as key negatives, even if partly offset by central bank buying [T6]. If private flows turn while official flows hold steady, price discovery tilts to the marginal private seller.
FX translation risk. EUR gold returns depend on EUR/USD. A euro recovery against the dollar would reduce EUR-denominated returns even if USD gold is stable. EUR/USD’s -3.60% one-month move has recently flattered EUR gold; that tailwind can reverse.
Drawdown and positioning risk. Gold is down 5.29% over 30 days and 20.35% from the January ATH, so near-term momentum is negative. If the debasement trade becomes over-owned, fading inflation or geopolitical fears could trigger a sharper unwind than the fundamental channels alone would justify [T1].
Data risk. The bundle lacks direct real-yield series, inflation breakevens, DXY, ETF flows, CFTC positioning, and BTC/ETH return data. Conclusions relying on these variables carry inference risk, and the market-cap and volume figures describe a tokenised proxy, not the full bullion market.
Appendix
Sources
- [T1] Gold Holds Above $4,000 Even as US Treasury Yields Top 5% — Institutions Say Gold’s Pricing Logic Is “Re-Anchoring” — BigGo Finance
- [T2] Central Bank Gold Purchases Hit 1,000t Average: WGC Survey
- [T3] Is it a golden era for gold? | J.P. Morgan Private Bank U.S.
- [T4] WisdomTree Gold Monthly | NL
- [T5] Ricky Ho (X post)
- [T6] Gold’s slowdown doesn’t signal a reversal | Lombard Odier
- [T7] Central Bank Gold Reserves Survey 2026 | World Gold Council
- [T8] Global monetary tightening: Energy shocks put inflation back in focus | LSEG
Data Caveats and Source Hierarchy
Bundle generated at 2026-10-10T04:52:48Z; market data retrieved at 04:52:40Z. As-of dates differ across datasets: equities as of 2026-10-09, euro area yield curve as of 2026-10-08, FX as of 2026-10-10. Datapoints should not be treated as fully simultaneous. Where third-party summaries duplicate WGC survey figures, the WGC source is used as the primary reference. WGC, J.P. Morgan, Lombard Odier, and LSEG carry greater analytical weight than news summaries and the social-media item [T5], which is used only as a cautionary framing point.
Unavailable metrics: real-yield series, inflation breakevens, CPI and wage data, USD index (DXY), ETF flow data, CFTC positioning, jewellery and bar-and-coin demand volumes, mine supply, and direct Bitcoin and Ethereum price or return series are not provided in this bundle. Relative performance statements versus crypto assets are therefore qualitative and aggregate-level only. Market cap, circulating supply, and market-cap rank describe the tokenised gold proxy (PAXG) and must not be read as global gold-market statistics.
Compliance
This report is AI-generated and is provided for informational purposes only. It does not constitute investment advice, a recommendation, or an offer to buy or sell any financial instrument. Data are sourced from third parties and may contain errors or gaps. Investors should conduct their own analysis and consult a licensed advisor before acting.
Important Note / Wichtiger Hinweis:
EN: This report may have been generated using AI. It processes data from publicly available sources. The content is provided for informational purposes only.DE: Dieser Bericht kann mithilfe von KI erstellt worden sein. Dabei werden Daten aus öffentlich zugänglichen Quellen verarbeitet. Die Inhalte dienen ausschließlich Informationszwecken.
* DE: Die ergänzenden Inhalte können KI-generiert sein. EN: The additional content may be AI-generated.