
Watch the video
This player shows only the Gold chapter of the daily altii market briefing. Watch the full video on tube.altii.de.
Key Data Snapshot
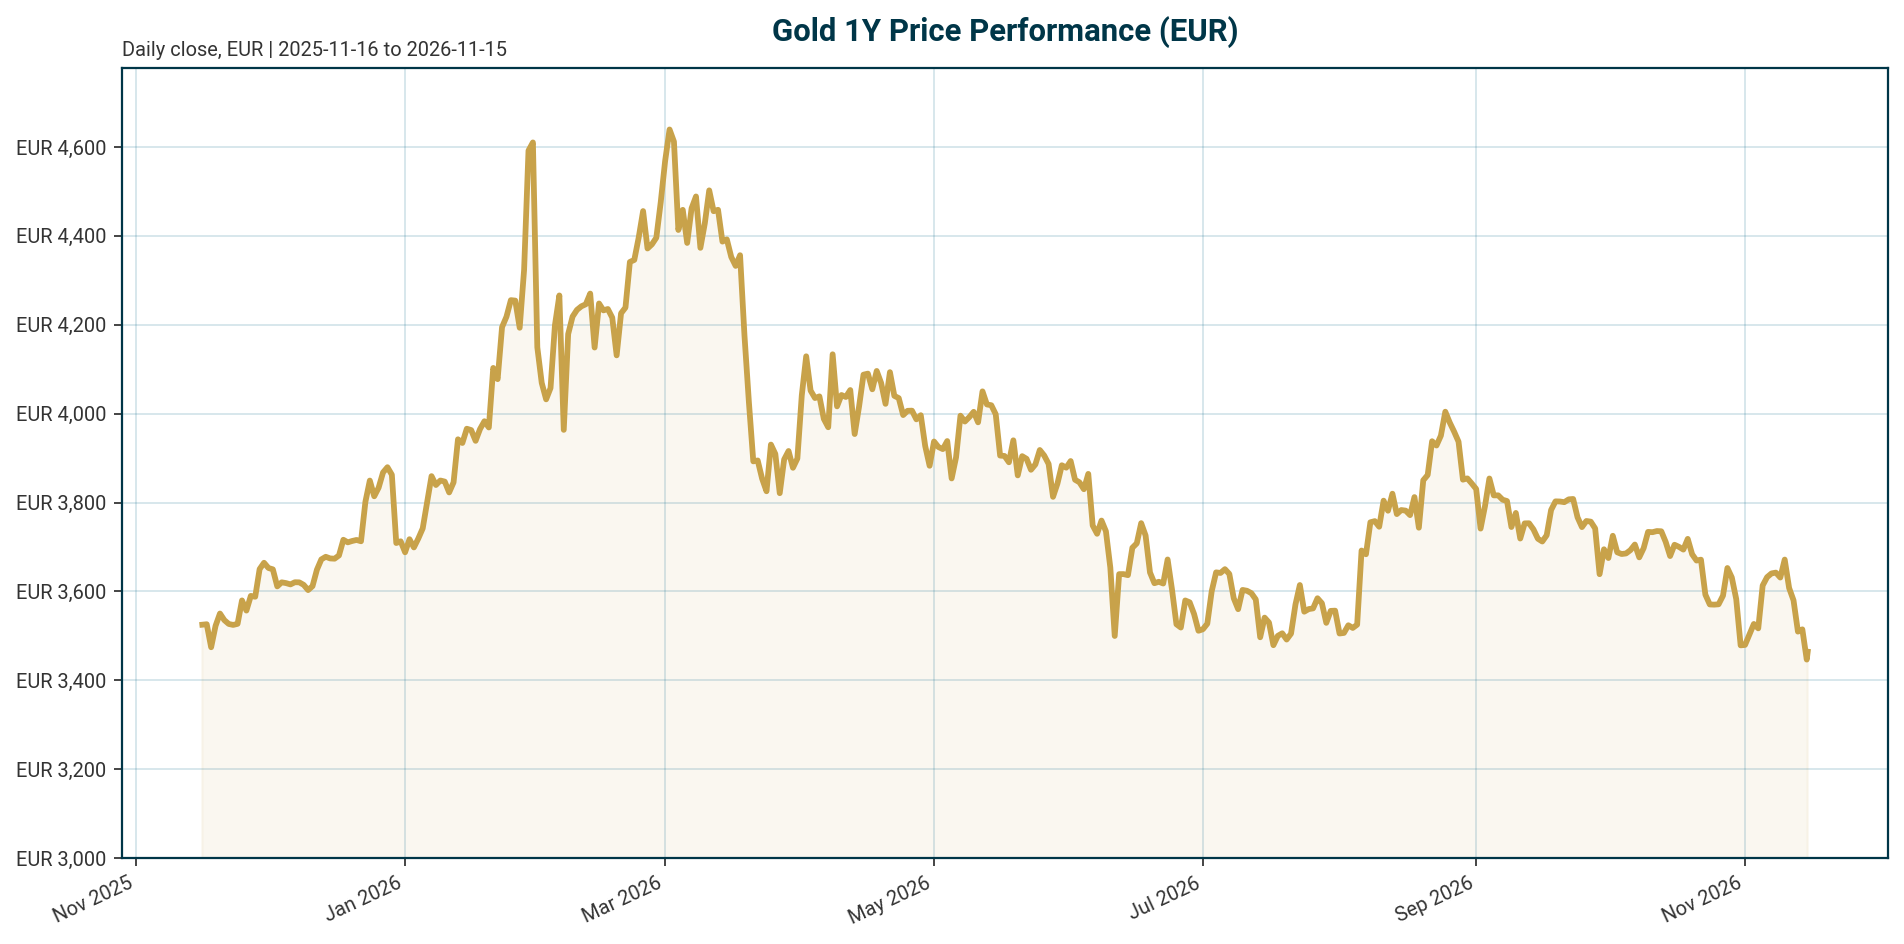
Gold (XAU) trades at EUR 3,464.36 as of 2026-11-15 (05:21 UTC), down 1.13% over 24 hours and 5.87% over 7 days. The 24-hour range spans EUR 3,415.17 to EUR 3,508.50 on token volume of EUR 126.46 million. The metal sits 26.11% below its all-time high of EUR 4,688.32 set on 2026-01-28, calculated as (3,464.36 / 4,688.32 – 1) = -26.11%, and 173.80% above its 2019 low of EUR 1,265.28.
| Metric | Value | As of |
|---|---|---|
| XAU/EUR price | EUR 3,464.36 | 2026-11-15 |
| Performance 24h / 7d / 30d | -1.13% / -5.87% / -8.59% | 2026-11-15 |
| Performance 200d / 1y | -16.72% / -6.23% | 2026-11-15 |
| All-time high (EUR) | 4,688.32 (-26.11% from ATH) | 2026-01-28 |
| All-time low (EUR) | 1,265.28 (+173.80% from ATL) | 2019-11-17 |
| Fed funds target range | 3.75% to 4.00% (last change: +25 bp, effective 2026-09-17) | 2026-11-14 |
| ECB deposit facility rate | 2.50% (last change: +25 bp, effective 2026-09-16) | 2026-11-15 |
| Euro area AAA 2Y / 5Y / 10Y / 30Y yield | 3.08% / 3.13% / 3.37% / 3.62% | 2026-11-12 |
| Euro AAA 10Y-2Y spread | 29.2 bp | 2026-11-12 |
| EUR/USD | 1.1079 (-0.88% 5d, -5.71% YTD) | 2026-11-15 |
| EUR/CHF / EUR/JPY / EUR/GBP | 0.9251 / 177.14 / 0.83551 | 2026-11-15 |
Macro Backdrop
The market overview shows neutral risk sentiment with moderately negative equity momentum. DACH equities are outperforming: the DACH 5-day average sits at +1.62% versus +0.10% for global equity indicators, with the DAX at 26,749.95, up 5.74% over one month. The Nikkei 225 leads 5-day moves at +4.03% while the Hang Seng is weakest at -3.32%. Rates are the dominant macro force for gold: euro area AAA yields are mixed with a flattening curve, the 10Y at 3.37% (up 8.2 bp over 5 days and 41.92 bp YTD) and the 10Y-2Y spread at 29.2 bp. FX is mixed, with EUR/USD at 1.1079, down 0.88% over 5 days and 5.71% YTD, and EUR/CHF posting the strongest 5-day move at +0.28%.
Policy is the core headwind. The Federal Reserve funds target stands at 3.75% to 4.00% after a 25 bp hike effective 2026-09-17, and the ECB deposit rate is 2.50% after a 25 bp hike effective 2026-09-16. According to [T7] from November 2026, the US 10-year yield climbed back above 5.1% and hawkish Fed rhetoric, including New York Fed President Williams calling inflation “stubbornly persistent and elevated”, pushed gold to its weakest level since October 2025 near $3,850. According to [T6] from November 2026, the dollar reached a 19-month high by November 12 as gold extended losses. For EUR-based investors, the weaker euro partially cushions USD-side declines in the EUR-quoted price.
Investment Thesis
Gold is caught between two opposing forces: a structural, price-insensitive official-sector bid and a cyclical, policy-driven carry headwind. The structural side is well documented. Central banks have bought roughly 1,000 tonnes per year over the past four years, double the average of the previous decade, and official holdings now exceed 36,000 tonnes, the highest since 1975 [T5]. ECB research cited in [T5] shows that, within official reserve portfolios, gold now accounts for 27% of reserve assets versus 22% for US Treasuries — these are portfolio composition shares, not interest rates. Survey evidence reinforces the trend: a record 43% of 73 monetary authorities expect to raise gold reserves over the next year [T1], and the World Gold Council survey shows 45% expecting to increase holdings [T5].
The cyclical side is hostile. The Fed funds target of 3.75% to 4.00% follows a September hike, and according to [T6] from November 2026, traders assigned roughly a 91% probability to a further quarter-point Fed hike in December after upside CPI surprises. The US 10-year yield above 5.1% per [T7] from November 2026 makes the zero-yield carry cost of bullion historically high. For EUR holders, the euro AAA 10Y at 3.37% adds a second layer of opportunity cost, though EUR/USD down 5.71% YTD has cushioned EUR-quoted returns relative to USD gold.
Base case (assumption): central bank buying continues at a pace at least matching 2025 levels, per the World Gold Council Q3 outlook cited in [T6] from November 2026, offsetting investment outflows while policy stays restrictive. Gold ranges sideways-to-lower in EUR terms. The bull case requires a policy pivot that pulls real yields lower; the bear case requires the December hike to land and break key support.
Bullish Drivers
The structural bid rests on four pillars. First, scale: central bank net purchases hit a record 1,082 tonnes in 2022 per [T1], with WGC data cited in [T7] and [T8] putting the figure at 1,136 tonnes worth around $70 billion, and the pace was sustained through 2023 and 2024 [T1]. Second, resilience: according to [T6] from November 2026, central bank buying surged 42% as prices dipped below $4,000, and the WGC raised its 2026 full-year purchase expectation to at least match 2025 levels. Third, breadth of intent: China extended its buying streak to 15 consecutive months, adding 8.1 tonnes in one month to reach roughly 2,305 tonnes [T3], while Poland targets around 700 tonnes, up from roughly 550 tonnes, signalling strategic rather than tactical accumulation [T4]. Fourth, motivation: the WGC survey in [T5] finds 90% of central banks cite gold’s crisis performance, with store-of-value, diversification and sanctions-shield motives ranked highly, driven largely by emerging markets including Russia, China, Turkey, India and Kazakhstan.
Expressed as a flow, roughly 1,000 tonnes per year against an official base above 36,000 tonnes implies official demand absorbs close to 2.8% of existing official holdings annually, a persistent and price-insensitive absorption mechanism. On the cyclical side, according to [T4], ING’s US economist expects the Fed to begin cutting rates with policy becoming incrementally less restrictive, and even a modest easing cycle would lower real yields and reduce the opportunity cost of holding non-yielding assets. This is a dated source expectation, not a decision.
Relative Positioning vs Bitcoin and Ethereum
Crypto context from the bundle: total crypto market capitalisation stands at USD 2.02 trillion with 24-hour volume of USD 105.90 billion and Bitcoin dominance at 58.66%. Ethereum benchmark data is not available in this dataset, so the comparison relies on market-level figures and qualitative positioning.
Gold’s 30-day EUR return of -8.59% and 200-day return of -16.72% frame the cross-asset picture. According to [T2] from November 2026, the debate over $80,000 versus $60,000 Bitcoin plays out against gold and oil signalling persistent inflation risks, meaning hard-asset demand competes with increasingly selective liquidity allocation. Both gold and crypto face the same hawkish-rate headwind, with the Fed at 3.75% to 4.00% and a possible December hike priced per [T6] from November 2026. The key difference is the buyer base: gold’s demand is anchored by price-insensitive central banks, while crypto has no official-sector bid and is more sensitive to liquidity conditions. In a hawkish-continuation regime (assumption), gold’s central-bank floor should limit drawdowns relative to crypto. In a liquidity-driven easing regime (assumption), crypto’s higher beta could outperform, making the timing of the policy pivot the decisive variable for relative positioning.
Scenario Framework
Three scenarios, all explicitly assumptions rather than forecasts:
Hawkish continuation. The December Fed hike, priced at roughly 91% market-implied probability per [T6] from November 2026, is delivered and USD real yields rise further. Gold tests and potentially breaks support near $3,970 per [T6], which converts to roughly EUR 3,583 at the bundle EUR/USD rate of 1.1079 (indicative conversion, not a historical rate). EUR gold underperforms but is partly cushioned by the softer euro. The euro AAA 10Y at 3.37% and the 29.2 bp 10Y-2Y spread anchor the EUR-side constraint.
Policy pivot. Inflation disappoints and the Fed pauses or reverses from the 3.75% to 4.00% range. Real yields fall, the carry cost declines, and gold recovers toward its EUR all-time-high region. Timing cannot be stated as fact; the only sourced expectation is ING’s economist view of eventual easing per [T4], which predates the September hikes and should be treated as stale until refreshed.
Stagflationary shock. A supply-driven energy shock lifts inflation, keeps central banks on hold or hiking, and strengthens the dollar. Per [T3], this dynamic produces a safe-haven failure: gold sells off during the geopolitical crisis because rising yields and a strong dollar outweigh the inflation hedge, as seen in 2022 after Russia’s invasion of Ukraine. This is the least intuitive but historically validated risk path.
Valuation Discussion
At EUR 3,464.36, gold trades 26.11% below its January 2026 peak but 173.80% above its 2019 low. The negative 12-month return of -6.23% despite central bank buying of roughly 1,000 tonnes per year suggests the marginal price is set by investment flows, not official demand, meaning the correction reflects rate-sensitive sellers hitting a slower structural bid rather than a collapse in underlying demand.
The carry framework argues gold is not yet cheap. A euro AAA 10Y at 3.37% and a US 10-year above 5.1% per [T7] from November 2026 make the opportunity cost of zero-yield bullion historically elevated on both sides of the Atlantic. However, valuation via real-yield models is complicated: [T1] notes the inflation-hedge property is often transitory and the real-yield relationship broke down over the past two years. An alternative framing, per [T2] from November 2026, judges gold against central bank reserve-allocation flows: per [T5], gold’s share of official reserve assets (27%) has overtaken that of US Treasuries (22%) — composition shares, not yield or policy-rate levels — implying structural re-rating potential. On balance (assumption): if central bank buying matches 2025 levels per the WGC outlook in [T6], the structural floor argues current EUR prices are closer to fair value than the 26% drawdown implies. If the December hike lands and yields make new highs, carry-based support weakens and a further de-rating toward lower support zones is plausible.
Risks
Near-term policy risk. The roughly 91% market-implied probability of a December Fed hike per [T6] from November 2026 is an expectation that may have shifted since publication. A larger-than-25 bp move, flagged as possible in [T6], would be an incremental bearish shock. Hawkish rhetoric from Williams and Daly per [T7] from November 2026 reinforces the tightening bias.
USD and yield risk. The dollar at a 19-month high per [T6] and the US 10-year above 5.1% per [T7] are direct headwinds. A hawkish ECB at a 2.50% deposit rate limits EUR-side relief, and euro AAA yields up 41.92 bp YTD raise EUR-denominated carry costs.
Safe-haven failure risk. Per [T3], supply-driven energy shocks push yields and the dollar higher, causing gold to sell off during geopolitical crises rather than rally. Investors relying on gold as a crisis hedge should note this failure pattern.
Flow risk. Central bank demand is the structural pillar. Any slowdown in official purchases would remove the price-insensitive floor identified in [T4].
Data risk. Several sources ([T3], [T4]) reference earlier-2026 data windows, including April payrolls and Q2 easing expectations, that conflict with the November 2026 policy state. Figures from these sources are cited only with explicit dating and never as the current state. Additionally, the XAU/EUR price derives from the PAX Gold token, which can carry a premium or discount to physical spot gold.
Appendix
Methodology and provenance. Market data was retrieved 2026-11-15T05:21Z. Equity and FX data are as of 2026-11-13 and 2026-11-15 respectively; the euro yield curve is as of 2026-11-12; policy rates are as of 2026-11-14 (Fed) and 2026-11-15 (ECB). Policy rate levels and decisions are taken exclusively from the authoritative policy rates block: the Fed funds target range of 3.75% to 4.00% after a 25 bp hike effective 2026-09-17, and the ECB deposit facility rate of 2.50% after a 25 bp hike effective 2026-09-16. News figures are quoted with source dates; [T6] and [T7] are dated November 2026, [T8] is dated 11 November 2026, and [T1], [T3], [T4], [T5] are undated and treated with caution. The 27% and 22% figures from [T5] refer to the composition of official reserve assets (gold versus US Treasuries), not to any interest rate or policy rate. No euro area or US inflation level is present in the dataset, so real-yield analysis relies on dated news references only. Ethereum benchmark data is not available in the dataset. XAU/EUR is quoted via the PAX Gold proxy, with a market capitalisation of EUR 1.55 billion reflecting tokenised supply of 447,519 units, not physical gold market capitalisation.
Glossary. Real yields: nominal bond yields minus expected inflation, the primary driver of gold’s opportunity cost. 10Y-2Y spread: the difference between 10-year and 2-year yields, a flattening signal of policy tightness. Opportunity cost: the yield forgone by holding a non-yielding asset. Central bank net purchases: official-sector gold buying net of sales, reported in tonnes. Reserve composition share: an asset’s percentage weight within official reserve portfolios. BTC dominance: Bitcoin’s share of total crypto market capitalisation.
Sources
- [T1] Is it a golden era for gold? | J.P. Morgan Private Bank U.S.
- [T2] Does $80,000 Bitcoin remain more likely than $60,000 as Gold and Oil signal persistent inflation risks?
- [T3] Why gold isn’t acting like a safe haven right now | ING THINK
- [T4] Why the gold rally isn’t over yet | ING THINK
- [T5] Central bank gold holdings are at a 50-year high. What’s behind the jump in reserves?
- [T6] Central Bank Gold Buying Surges 42% as Prices Dip Below US$4000
- [T7] Gold Forecast: Sellers dominate on hawkish repricing of Fed interest rate outlook
- [T8] Gold drops below $4,000 amid mounting bets on a Fed rate hike
Disclaimer. This report is AI-generated, for informational purposes only, and does not constitute investment advice. Figures reflect the data snapshot of 2026-11-15 and cited sources as dated; market conditions may have changed since publication. Readers should conduct their own research and consult a licensed advisor before making investment decisions.
Important Note / Wichtiger Hinweis:
EN: This report may have been generated using AI. It processes data from publicly available sources. The content is provided for informational purposes only.DE: Dieser Bericht kann mithilfe von KI erstellt worden sein. Dabei werden Daten aus öffentlich zugänglichen Quellen verarbeitet. Die Inhalte dienen ausschließlich Informationszwecken.
* DE: Die ergänzenden Inhalte können KI-generiert sein. EN: The additional content may be AI-generated.