
Watch the video
This player shows only the Gold chapter of the daily altii market briefing. Watch the full video on tube.altii.de.
Key Data Snapshot
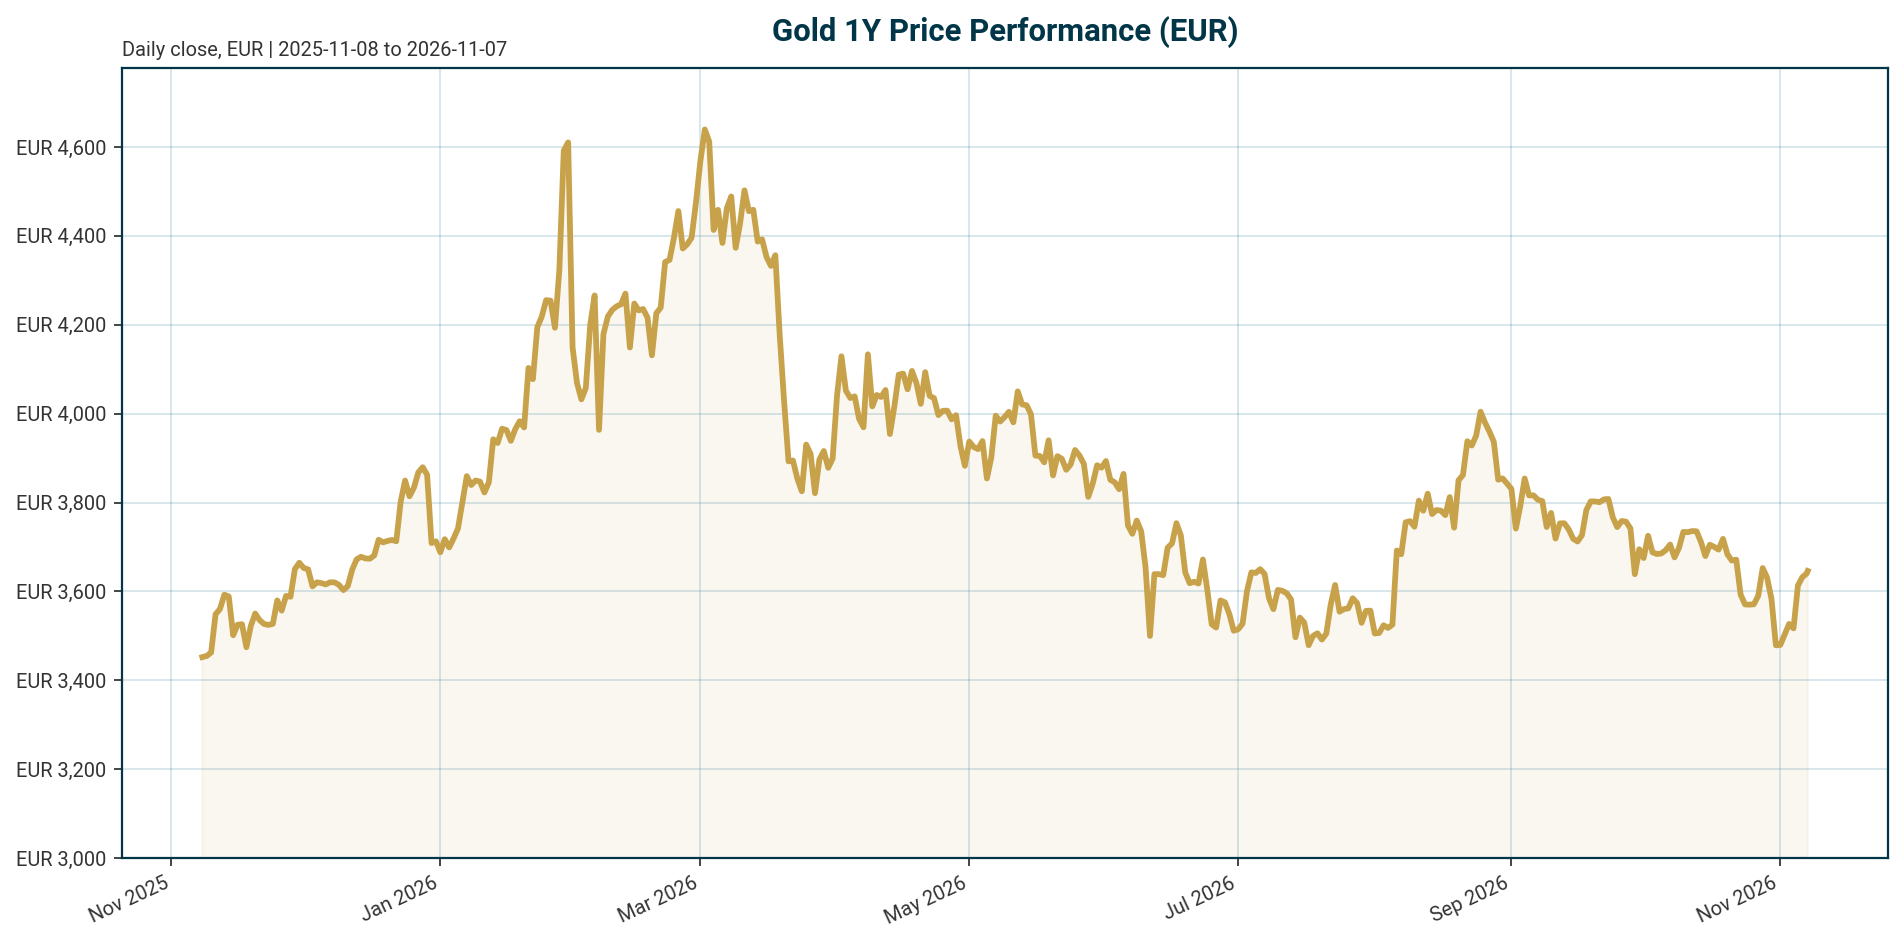
XAU/EUR trades at EUR 3,645.88 as of 7 November 2026 (05:20 UTC), recovering on a 7-day basis while remaining deep in a correction from the January peak. The table below consolidates the hard numbers used throughout this report.
| Metric | Value | Change / Context |
|---|---|---|
| XAU/EUR price | EUR 3,645.88 | +1.11% 24h, +4.42% 7d, -1.85% 30d, -14.98% 200d, +2.07% 1y |
| 24h range | EUR 3,605.49 to EUR 3,651.98 | 24h volume EUR 116.87m |
| All-time high | EUR 4,688.32 (2026-01-28) | -22.23% below; upside to ATH +28.59% |
| All-time low | EUR 1,265.28 (2019-11-17) | +188.15% above |
| Fed funds target range | 3.75% to 4.00% (as of 2026-11-06) | Last change: +25 bp hike, effective 2026-09-17 |
| ECB deposit facility rate | 2.50% (as of 2026-11-07) | Last change: +25 bp hike, effective 2026-09-16 |
| US 10Y TIPS yield | 2.64% (4 Nov, per [T1]) | Nominal 10Y at 4.9% |
| Euro Area AAA 10Y yield | 3.29% (as of 2026-11-05) | -7.1 bp over 5d, -22.5 bp over 1m, +34.6 bp YTD |
| EUR/USD | 1.1217 (as of 2026-11-07) | +0.24% 5d, -4.54% YTD |
| Central bank Q3 net purchases | 321 tonnes (per [T6]) | Fastest pace since late 2024 |
| September net purchases | 61 tonnes (per [T5]) | Highest monthly total of 2026 |
| Gold ETF holdings | Record 4,256 tonnes (per [T1], [T3]) | +211.2t post-Q2 inflows; Q3 inflows a record USD 31bn (per [T3]) |
| Token proxy market cap | EUR 1.63bn (PAX Gold proxy, rank 50) | Circulating supply 447,724.83 units; ~7.2% daily turnover (116.87m / 1,632.4m) |
Macro Backdrop
Risk sentiment is negative and equity momentum is broadly negative. The Nikkei 225 is the weakest 5-day performer at -9.25% while the Hang Seng is the strongest at +4.65%; the S&P 500 is down 5.45% over one month and the Nasdaq Composite down 10.75%. DACH equities are outperforming, averaging -0.27% over 5 days versus -2.28% for global equity indicators, with the DAX up 2.85% on a 1-month basis. The rates backdrop is mixed: the Euro Area AAA 10Y yield sits at 3.29% after a -7.1 bp 5-day move, the AAA 2Y at 2.96%, and the 10Y-2Y spread at 33.5 bp. FX is mixed, with EUR/USD at 1.1217 (+0.24% over 5d) and EUR/JPY posting the strongest 5-day FX move at +0.32%.
Policy is restrictive on both sides of the Atlantic. The Federal Reserve funds target range stands at 3.75% to 4.00% following a 25 bp hike effective 17 September 2026, and the ECB deposit facility rate is 2.50% following a 25 bp hike effective 16 September 2026. The October US payrolls print of 165,000 jobs, significantly above expectations, reinforced the case for policy staying restrictive for longer, according to the Kitco report of 6 November [T4]. The energy-shock dynamic described by ING, in which supply-driven inflation keeps central banks on hold and supports the dollar while weighing on gold, remains the key cyclical headwind [T2]. Emerging market central banks, including Turkey, India and Thailand, have sold reserves including gold to defend currencies, and EMDE holdings of US Treasuries at the New York Fed have fallen to their lowest level since 2012 [T7].
This backdrop frames the gold analysis: restrictive policy and elevated real yields argue for weakness, while negative risk sentiment and structural official-sector demand argue for support.
Investment Thesis
The core tension in gold today is a broken valuation anchor. Textbook logic says a non-yielding asset should struggle when the 10-year TIPS yield pays 2.64% and the nominal 10-year 4.9%, as they did on 4 November [T1]. Yet the official sector bought heavily anyway. Central banks added a net 321 tonnes in Q3 2026, the fastest pace since late 2024, driven by diversification away from the dollar and sanctions-risk hedging [T6]. September alone saw 61 tonnes of reported net purchases, the highest monthly total of 2026, led by Poland and China [T5]. The marginal buyer now prices sanctions exposure and government debt loads rather than Treasury yields, which weakens gold’s traditional link to interest rates [T1].
Investment demand reinforces the structural story. Gold ETFs added 211.2 tonnes after second-quarter outflows, lifting global holdings to a record 4,256 tonnes, with inflows tied to fiscal sustainability and inflation concerns [T1]; Q3 inflows reached a record USD 31 billion [T3]. Supply cannot easily answer this demand: mine output rose 3% to a Q3 record of 1,071 tonnes, but total supply slipped about 1% as recycling weakened and producers reduced hedging [T1].
The bear side is equally concrete. The ECB’s Financial Stability Review flags that gold volatility has risen more than equities’ volatility, citing rising real yields, deleveraging, indications of central bank sales in some emerging markets, and crowded retail positioning that could drive procyclical price dynamics [T8]. The 200-day return of -14.98% shows this correction is real. Our base case, as a labeled assumption, is that structural official-sector and ETF demand provide a floor while restrictive rates cap upside, keeping XAU/EUR in a volatile range below the January high.
Bullish Drivers
- Official-sector accumulation at speed. Q3 net purchases of 321 tonnes were the fastest since late 2024, with year-to-date aggregate purchases 6% higher than last year [T6]. On the reported-only basis, September’s 61 tonnes was the strongest month of 2026, led by Poland and China, with Uzbekistan, Kazakhstan, Jordan, the Czech Republic and Bolivia also net buyers [T5].
- Sanctions-risk logic is price-insensitive. Central banks buy to diversify reserves away from the dollar and to hold an asset no foreign government can block, so elevated prices rarely discourage them [T1].
- Record ETF demand. Holdings reached a record 4,256 tonnes after 211.2 tonnes of post-Q2 inflows [T1], with roughly 187 tonnes added in August and September alone and Q3 inflows at a record USD 31 billion [T3]. The 211.2t inflows equal roughly 5.2% of total holdings (211.2 / 4,256).
- Constrained supply. Despite record mine output of 1,071 tonnes in Q3, total supply fell about 1% on weaker recycling and reduced producer hedging [T1].
- Geopolitical and fiscal uncertainty. Persistent geopolitical uncertainty remains a stated support [T4], and the World Gold Council tied ETF inflows to fiscal sustainability and inflation concerns [T1]. In India, elevated prices moderated discretionary jewellery demand, but wedding-related and investment demand stayed resilient [T3].
- The hike threat alone may be the constraint. Per the Kitco commentary of 6 November, gold does not need Fed cuts to regain bullish momentum; removing the threat of additional hikes, a weaker dollar and lower real yields could suffice [T4].
Relative Positioning vs Bitcoin and Ethereum
The bundle does not contain BTC or ETH price, return or market-cap data, so a direct head-to-head comparison cannot be quantified and no figures are invented. What the data do show: the total crypto market cap stands at USD 2.30 trillion with 24h volume of USD 58.66 billion and Bitcoin dominance at 59.28%. Tokenized gold, proxied by PAX Gold, has a market cap of EUR 1.63 billion, rank 50, and 24h volume of EUR 116.87 million, a fractional footprint relative to the crypto complex that matters for liquidity and flow comparisons.
Directionally, gold’s +4.42% 7-day return against a negative risk-sentiment regime, in which the S&P 500 fell 2.18% and the Nikkei 9.25% over 5 days, supports its defensive role relative to high-beta risk assets, crypto included. The caveat cuts the other way: the ECB FSR notes gold’s volatility has risen more than equities’ volatility, with crowded retail positioning raising procyclical unwind risk [T8]. If positioning unwinds further, gold’s short-horizon risk profile converges toward risk-asset behavior and its diversification advantage over crypto narrows. This is a scenario assumption, not a measured correlation.
Scenario Framework
All three scenarios are labeled assumptions anchored to the current policy settings: Fed funds target range of 3.75% to 4.00% and ECB deposit rate of 2.50%, both after September hikes.
- Bull scenario (assumption). Inflation moderates and the Fed signals no further hikes. Per [T4], removing the hike threat, combined with a weaker dollar and declining real yields, could revive inflows without any cuts. ETF inflows resume at the August-September pace of roughly 187 tonnes over two months [T3], and XAU/EUR challenges the EUR 4,688.32 ATH region, which implies +28.59% upside from the current price.
- Base scenario (assumption). The Fed and ECB hold at current restrictive levels after their September hikes. Central bank buying continues near the Q3 pace of 321 tonnes per quarter [T6], offsetting elevated real yields. XAU/EUR consolidates in the current range with elevated volatility, consistent with the 2026 pattern of sharper swings than the one-directional 2025 rally [T3].
- Bear scenario (assumption). A further Fed hike or a renewed energy shock lifts real yields and the dollar, the dynamic ING describes as pressuring gold during supply-driven inflation episodes [T2]. EMDE central bank gold sales for FX defense [T7] and procyclical retail deleveraging [T8] deepen the drawdown beyond the current -14.98% over 200 days.
Market expectations for the next Fed move are not settled: the 6 November Kitco commentary states the strong jobs report raises the likelihood rates stay elevated longer, but another hike is not certain, and moderating inflation, slowing activity and delayed policy effects could deter further tightening [T4]. This is a dated source characterization, not a decision.
Valuation Discussion
XAU/EUR at 3,645.88 sits 22.23% below the January 2026 ATH of 4,688.32 but 188.15% above the 2019 low of 1,265.28. The 1-year return of +2.07% against a 200-day return of -14.98% shows momentum has rolled over on longer horizons even as the 7-day recovery (+4.42%) takes hold. This is a long bull market in a corrective phase, not a fresh trend.
The valuation problem is that the traditional anchor is unreliable in both directions. If the real-yield anchor is genuinely broken, as the official-sector behavior suggests, with buyers absorbing a 2.64% 10-year TIPS yield without hesitation [T1], then fair value is set by official-sector accumulation and the 22% drawdown is potentially attractive rather than a warning. If the anchor reasserts itself, mean-reversion logic argues the January ATH marked a valuation extreme that a 2.64% real yield cannot justify for a non-yielding asset.
Positioning adds a second lens. The ECB FSR’s observation of elevated retail participation and crowded positioning [T8] skews valuation risk toward procyclical drawdowns in stress episodes. On the supply side, record mine output of 1,071 tonnes in Q3 alongside a 1% decline in total supply [T1] is a tightness datapoint rather than a valuation metric. We do not assign a point fair value; the honest conclusion is that gold’s valuation depends on which buyer regime prevails, and the flow evidence currently favors the official sector.
Risks
- Further Fed tightening. The October jobs beat of 165,000 supports restrictive policy for longer at the current 3.75% to 4.00% target range [T4]. Another hike is not certain but the risk is live, and a hawkish surprise would lift real yields directly against gold.
- Real-yield opportunity cost. A 2.64% 10-year TIPS yield and a 4.9% nominal 10-year [T1] represent a high annualized carry against a non-yielding position. For EUR-based investors, the Euro Area AAA 10Y at 3.29% nominal is the domestic alternative; no euro-area inflation print is in the dataset, so the euro real yield cannot be computed here.
- EMDE reserve defense. Central banks including Turkey, India and Thailand have sold reserves including gold to defend currencies, with Turkey’s gold reserves marking their largest weekly drop in seven years [T7]. This flow directly offsets the structural buying thesis.
- Positioning and volatility risk. The ECB FSR flags gold volatility above equities’, deleveraging dynamics, indications of EM central bank sales, and crowded retail positioning [T8].
- Safe-haven failure. Gold sold off during the current conflict because a supply-driven energy shock strengthens the dollar and yields rather than triggering the growth-shock pattern in which gold excels [T2].
- Data-quality caveats. Central bank YTD totals conflict on methodology: 228 tonnes reported-only, 7% lower than last year [T5], versus aggregate purchases 6% higher [T6]. The XAU/EUR price derives from a tokenized proxy (PAX Gold), not physical spot. Several news sources lack publication dates, and figures from them are cited with source attribution only.
Appendix
Policy Rate Provenance
US Federal Funds Target Range: 3.75% to 4.00% as of 2026-11-06; last change a 25 bp hike effective 2026-09-17. ECB Deposit Facility Rate: 2.50% as of 2026-11-07; last change a 25 bp hike effective 2026-09-16. No other central bank policy rates are in the dataset; where other central banks matter to the narrative (for example the RBI), the dataset contains no rate level and none is stated.
Methodology Notes
XAU/EUR pricing uses the PAX Gold token proxy (coingecko_id pax-gold), retrieved 2026-11-07T05:20Z. Token market cap of EUR 1.63 billion reflects tokenized supply of 447,724.83 units, not the full gold market, and may deviate from LBMA or physical spot. Token liquidity ratio: 24h volume of EUR 116.87 million against EUR 1.63 billion market cap equals approximately 7.2% daily turnover. Drawdown calculation: (3,645.88 / 4,688.32) – 1 = -22.23%; upside to ATH: (4,688.32 / 3,645.88) – 1 = +28.59%. The USD-quoted technical levels cited from [T4] (USD 4,000 support, USD 4,170 breakout) are not converted to EUR here because the Kitco levels date from 6 November and the EUR/USD rate of 1.1217 from 7 November, a timestamp mismatch that would introduce conversion error.
Data Gaps
No BTC or ETH price, return or market-cap data are in the bundle for the relative-positioning section. No euro-area inflation print is in the dataset, so euro real yields cannot be computed. No market-implied policy probabilities are available; all forward rate paths are labeled scenario assumptions or attributed to dated sources. Central bank YTD totals differ by methodology between [T5] (reported-only, 228t) and [T6] (aggregate, 6% higher); both are shown with labels. The [T1] figure of 211.2t post-Q2 ETF inflows and the [T3] figure of roughly 187t over August-September cover overlapping but not identical windows and are not summed.
Sources
- [T1] Central Banks Just Bought More Gold Than the World’s Jewelry Buyers. Something Big Is Changing. – 24/7 Wall St.
- [T2] Why gold isn’t acting like a safe haven right now | ING THINK
- [T3] Gold Prices Set to Soar: Predictions Point to Rs 1.68 Lakh Amid Global Uncertainties, ETRetail
- [T4] Gold price holds critical $4,000 support, but strong U.S. jobs data and inflation risks threaten recovery | Kitco News
- [T5] Central Bank Gold Statistics: September 2026 | World Gold Council
- [T6] Central Bank Gold Buying Surges as Jewelry Demand Slumps – WSJ
- [T7] Reserves, rates and risks: all eyes on EMDE currency policy | ODI: Think change
- [T8] Financial Stability Review, May 2026 | European Central Bank
Disclaimer
This report is AI-generated and provided for informational purposes only. It does not constitute investment advice, a recommendation, or an offer to buy or sell any financial instrument. Data may be incomplete, delayed, or derived from proxy instruments, and readers should verify all figures independently before making any investment decision.
Important Note / Wichtiger Hinweis:
EN: This report may have been generated using AI. It processes data from publicly available sources. The content is provided for informational purposes only.DE: Dieser Bericht kann mithilfe von KI erstellt worden sein. Dabei werden Daten aus öffentlich zugänglichen Quellen verarbeitet. Die Inhalte dienen ausschließlich Informationszwecken.
* DE: Die ergänzenden Inhalte können KI-generiert sein. EN: The additional content may be AI-generated.