
Watch the video
This player shows only the Bitcoin chapter of the daily altii market briefing. Watch the full video on tube.altii.de.
Key Data Snapshot
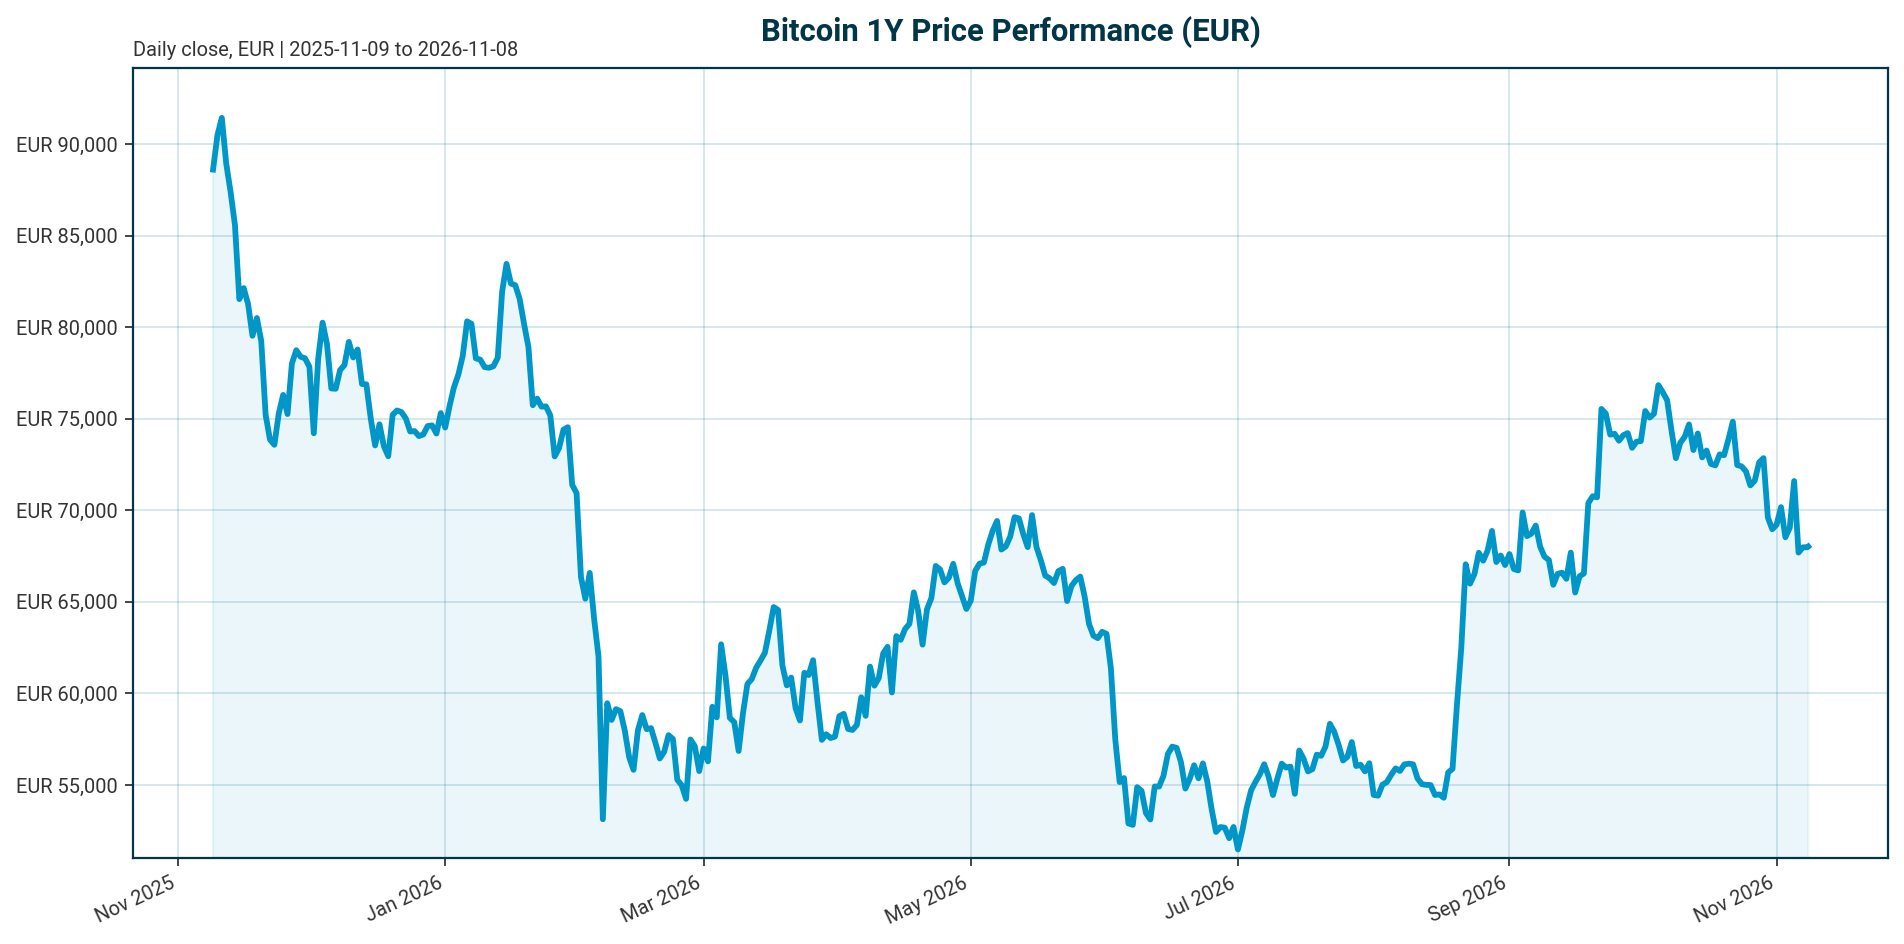
Bitcoin (BTC) trades at EUR 68,024 as of 8 November 2026, down 0.04% over 24 hours and 36.82% below its all-time high of EUR 107,662 set on 6 October 2025. The market remains in a drawdown regime across every measured horizon.
| Metric | Value |
|---|---|
| Price (EUR) | 68,024 |
| 24h range (EUR) | 67,771 to 68,318 |
| 24h volume (EUR) | 9.50 billion |
| Return 24h / 7d / 14d | -0.04% / -2.55% / -6.21% |
| Return 30d / 200d / 1y | -8.00% / -2.30% / -26.17% |
| All-time high (EUR) | 107,662 (6 Oct 2025); current drawdown -36.82% |
| Market cap (EUR) | 1.368 trillion, rank 1 |
| BTC dominance | 59.34% of a ~EUR 2.299 trillion total crypto market cap |
| Circulating supply | 20,109,412 BTC of 21,000,000 max (95.76% issued) |
| Fully diluted valuation | EUR 1.368 trillion (equals market cap) |
| Fed funds target range | 3.75% to 4.00% as of 2026-11-07; last change: hike of 25 bp, effective 2026-09-17 |
| ECB deposit facility rate | 2.50% as of 2026-11-08; last change: hike of 25 bp, effective 2026-09-16 |
Key calculations: supply issued is 20,109,412 / 21,000,000 = 95.76%. The 24h volume-to-market-cap ratio is 9.50bn / 1,368bn = roughly 0.69%, indicating deep liquidity but continued flow sensitivity. Reclaiming the ATH requires a 1.58x move from the current price (107,662 / 68,024).
Market Setup
The cross-asset backdrop is unsupportive. Risk sentiment is negative and global equity momentum is broadly negative, with the DACH complex outperforming: DACH indicators average -0.27% over five days versus -2.28% for global equity indicators. The Nikkei 225 is the weakest five-day performer at -9.25% and is down 17.99% over one month, while the Hang Seng is the strongest at +4.65% over five days. The S&P 500 is down 5.45% and the Nasdaq Composite down 10.75% over one month. The DAX leads on a one-month basis at +2.85% but fell 1.92% in its last session. Euro-area AAA 10Y yield sits at 3.29%, down 7.1 bp over five days, with the 10Y-2Y spread at 33.5 bp; the rates backdrop is mixed. FX is similarly mixed, with EUR/USD at 1.1214 (-0.11% over five days, -4.56% YTD). These observations frame, but do not drive, the Bitcoin analysis below.
The policy backdrop matters directly for a flow-driven risk asset. The Federal Reserve target range stands at 3.75% to 4.00% after a 25 bp hike effective 17 September 2026, and the ECB deposit facility rate stands at 2.50% after a 25 bp hike effective 16 September 2026. Both central banks last moved in a tightening direction, a liquidity headwind for Bitcoin and the broader digital asset complex.
Investment Thesis
Bitcoin now operates in an ETF- and macro-led regime. According to a year-end 2025 review [T2], 2025 was the first full year in which regulated capital flows and US monetary policy repricing dominated sentiment: every change in the probability of a Fed cut, or a spike in ETF redemptions, showed up almost immediately in crypto prices. Glassnode counted 6.7 million BTC across ETFs, exchanges and treasuries at end-2025, a level the platform described as Bitcoin’s “institutional supply era” [T2].
The current drawdown is best explained by that regime. Q2 2026 brought USD 4.67 billion in net spot Bitcoin ETF redemptions, the largest quarterly outflow since spot products launched in January 2024, with June alone a record month for redemptions; the pattern pointed to institutional profit-taking and rotation into traditional markets rather than a structural exit from the asset class, according to a July 2026 review [T1]. More recently, Bitcoin ETFs attracted USD 74.6 million on 4 November after three consecutive sessions of withdrawals, per a November 2026 report [T6], a tentative signal that the redemption cycle may be fading.
The medium-term upside rests on two levers. First, regulation: the CLARITY Act would establish a federal market-structure framework and could unlock broader institutional participation if passed [T1], but it failed to advance in the Senate in September [T8]. Second, structural adoption: Morgan Stanley expanded client access to regulated bitcoin products and Vanguard added third-party bitcoin ETFs in Q4 2025, per a February 2026 ARK article [T7]. The bear-side corollary is equally clear: institutional adoption has tied BTC more closely to traditional macro and credit cycles than during the retail era [T4], so the current global equity weakness transmits directly.
Base case: BTC consolidates in EUR terms while the market waits for a sustained return to positive ETF net flows. The thesis stays constructive on structure and neutral on timing.
Bullish Drivers
- ETF channel maturation. ETF flows have become Bitcoin’s new macro indicator, and regulated vehicles turned BTC into an allocatable line item for registered investment advisors, private banks and institutions [T2].
- Platform access expansion. Morgan Stanley expanded client access to regulated bitcoin products including spot ETFs, and Vanguard added third-party bitcoin ETFs after years of excluding crypto and all commodities from its platform [T7, February 2026].
- Potential fixed-income rotation. More than USD 10 trillion in lower-yielding money-market and fixed-income ETFs could be poised to rotate into risk assets, per ARK’s February 2026 article [T7]. This is a dated scenario claim, not a current-state fact.
- Regulatory frameworks in Asia. Hong Kong’s Stablecoins Ordinance requires full reserve backing, redemption rights and risk controls, and Asian institutional adoption is shifting from pilots to targeted deployment via tokenization [T1].
- Public-sector adoption. Texas is buying and adding bitcoin to state reserves, with discussions on adding bitcoin to government reserves and on managing seized federal holdings [T7, February 2026].
- Flow inflection. Renewed ETF inflows of USD 74.6 million on 4 November after three down sessions suggest institutional interest remains intact [T6, November 2026].
- Product expansion projections. Projections for 2026 include corporate holdings surpassing USD 250 billion and more than 100 new crypto-linked ETFs [T3]. These are projections, not established facts.
Confirmation signal: a sustained month of positive net ETF creations would indicate the Q2 2026 redemption cycle has ended. If the CLARITY Act or successor legislation advances, institutional approval processes ease and a fresh allocation wave into spot Bitcoin products becomes the primary upside trigger.
Relative Positioning vs Gold and Ethereum
Versus gold. No current gold price is available in the dataset, so the comparison is qualitative. In the present negative risk-sentiment regime, gold’s safe-haven bid would likely outperform BTC, which behaves as high-beta institutional flow exposure rather than a defensive hedge. BTC’s case against gold strengthens only when flows and regulatory catalysts return. Bitcoin’s volatility did fall from 84% to 43% per the Glassnode x Fasanara 2025 report [T2, dated claim], but institutional adoption has not eliminated volatility; it has deepened the linkage to macro and credit cycles [T4].
Versus Ethereum. No current Ethereum price or market cap is available in the dataset. On flows, Ethereum ETFs recorded USD 690 million in net outflows in Q2 2026, moving in sympathy with Bitcoin’s USD 4.67 billion redemptions [T1], confirming that the two assets share the same institutional flow channel. Bitcoin retains the strongest relative position: 59.34% dominance of a ~EUR 2.299 trillion total crypto market cap, the deepest ETF product shelf, and first call on institutional re-risking if market-structure legislation passes. The main dilution risk comes from altcoin ETF expansion (SOL, XRP and beyond), which could divert a growing share of institutional crypto flows away from the two largest assets [T5].
Scenario Framework
All levels below are illustrative planning assumptions derived from drawdown arithmetic, not price targets or forecasts.
| Scenario | Key assumptions | Illustrative EUR level |
|---|---|---|
| Bull | Market-structure legislation advances; Fed expectations shift toward easing; ETF flows turn sustainably positive. BTC retraces 50% to 70% of the 36.8% drawdown from ATH. | 85,000 to 95,000 |
| Base | Policy holds at current levels; flows stay choppy with alternating weekly creations and redemptions; structural adoption accumulates beneath the price. | 62,000 to 75,000 range |
| Bear | Legislative delay extends; redemptions resume at Q2 2026 pace; global equity weakness spills over and BTC breaks below its 30d trend. | 55,000 to 60,000 |
Policy anchors: the Fed target range is 3.75% to 4.00% and the ECB deposit rate is 2.50%. According to a July 2026 review [T1], the Fed under Chair Kevin Warsh was then expected to hold rates through Q3, leaving limited room for the policy easing that has historically supported risk-asset recoveries; this is a dated market expectation, not a decision. Regulatory anchors: the CLARITY Act failed to advance in the Senate in September [T8], and a September 15 vote on the Act had been flagged as a sentiment swing factor [T5]. Flow anchors: Q2 2026 net redemptions of USD 4.67 billion [T1] and the 4 November inflow of USD 74.6 million [T6].
Valuation Discussion
Bitcoin has no cash flows, so valuation rests on supply scarcity, positioning and flow dynamics. On supply, 95.76% of the 21 million maximum is issued, circulating supply equals total supply at 20,109,412 BTC, and fully diluted valuation equals market cap at EUR 1.368 trillion. Issuance-driven dilution is minimal, so the marginal price driver is institutional flow rather than new supply.
On positioning, BTC is 36.8% below its October 2025 ATH after a -26.17% one-year return, a substantial reset that occurred with no change to the supply schedule. The 30d return of -8.00% versus the 1y return of -26.17% suggests the steepest drawdown momentum is behind, though the 14d figure of -6.21% shows renewed pressure in recent weeks.
Valuation is flow-determined: with ETFs acting as Bitcoin’s new macro indicator, marginal price is set by institutional creations and redemptions rather than traditional fundamentals [T2]. If the drawdown is flow-driven rather than adoption-driven, the current level offers asymmetric entry pricing relative to the structural adoption trajectory, contingent on evidence of flow reversal. If macro tightening persists, the scarcity narrative alone is unlikely to defend the price; valuation support would depend on long-term holders absorbing ETF redemptions.
EUR quotation overlay: EUR/USD at 1.1214 is down 4.56% YTD, so EUR-quoted BTC returns embed USD weakness. A USD-quoted BTC price is not in the dataset, so no cross-currency return calculation is made. Flow figures from news sources remain in USD to avoid unstated FX assumptions.
Risks
- Policy tightening. Both the Fed (hike of 25 bp effective 2026-09-17, range 3.75% to 4.00%) and the ECB (hike of 25 bp effective 2026-09-16, 2.50%) last moved in a tightening direction. No easing cycle is in the dataset. A further hike or hawkish repricing would directly pressure the flow-driven valuation mechanism.
- Legislative and political uncertainty. The CLARITY Act failed to advance in the Senate in September, and a shift in congressional control after the midterms could complicate revival and increase regulatory scrutiny [T8]. Divided government could raise policy uncertainty and weigh on Bitcoin [T6].
- Custody and operational risk. Custody remains an operational risk even with qualified custodians; hacks and internal exploits could put funds at risk [T4].
- ETF issuer concentration. ETF assets are concentrated in a handful of issuers, raising market-structure risk if any issuer experiences operational stress [T4]. An issuer incident would hit the primary institutional access channel and could trigger outsized redemptions.
- DAT leverage amplification. Treasury-leveraged equity strategies have shown amplified drawdowns relative to the underlying token [T4].
- Macro linkage. Institutional adoption has tied BTC more closely to traditional macro and credit cycles, not made it less volatile in behavior [T4]. Record Q4 2025 ETF outflows coincided with BTC breaking USD 98,000 support, per a year-end 2025 review [T2]. The current cross-asset backdrop, with the Nasdaq down 10.75% and the Nikkei down 9.25% over five days, is a live transmission channel.
Appendix
Multi-horizon returns (EUR)
| Horizon | Return |
|---|---|
| 1h | -0.04% |
| 24h | -0.04% |
| 7d | -2.55% |
| 14d | -6.21% |
| 30d | -8.00% |
| 200d | -2.30% |
| 1y | -26.17% |
Cross-asset dashboard (as of 2026-11-06 to 2026-11-08)
| Instrument | Level | 5d change | 1m change | YTD |
|---|---|---|---|---|
| DAX | 25,820.36 | -0.62% | +2.85% | -1.90% |
| ATX | 6,434.80 | +0.07% | -2.68% | +21.05% |
| Euro Stoxx 50 | 6,144.90 | -0.18% | -0.70% | +6.02% |
| S&P 500 | 7,376.86 | -2.18% | -5.45% | +7.76% |
| Nasdaq Composite | 24,579.42 | -2.32% | -10.75% | +5.75% |
| Nikkei 225 | 57,434.77 | -9.25% | -17.99% | +14.09% |
| Hang Seng | 24,481.90 | +4.65% | +1.46% | -4.48% |
| Euro AAA 2Y yield | 2.96% | -4.7 bp | -9.4 bp | +85.0 bp |
| Euro AAA 5Y yield | 3.03% | -7.0 bp | -17.7 bp | +59.1 bp |
| Euro AAA 10Y yield | 3.29% | -7.1 bp | -22.5 bp | +34.6 bp |
| Euro AAA 30Y yield | 3.58% | -3.8 bp | -20.2 bp | +9.8 bp |
| EUR/USD | 1.1214 | -0.11% | -0.03% | -4.56% |
| EUR/CHF | 0.9162 | -0.19% | -1.75% | -1.50% |
| EUR/JPY | 177.38 | -0.17% | -0.07% | -3.48% |
| EUR/GBP | 0.83464 | +0.06% | -1.53% | -4.25% |
Policy rates
- US Federal Funds Target Range: 3.75% to 4.00% as of 2026-11-07; last change: hike of 25 bp, effective 2026-09-17.
- ECB Deposit Facility Rate: 2.50% as of 2026-11-08; last change: hike of 25 bp, effective 2026-09-16.
Data gaps
No current gold price, Ethereum price or market cap, on-chain metrics (exchange reserves, hash rate, long-term holder supply), options-implied distributions, or current-week ETF flow aggregates are available in the dataset. Several news items (T2, T3, T4, T5, T8) lack publication dates in the feed; figures from them are cited with the date context stated in the text where the source provides one.
Sources
- [T1] Q2 2026 Digital Asset Review (CoinDesk, July 2026): link
- [T2] Crypto Market 2025: Year-End Review & Expert Insights (TradingView News, undated in feed): link
- [T3] Crypto Analysis for 2026: Bitcoin, ETFs, Regulation (Blockchain Council, undated in feed): link
- [T4] Institutional Bitcoin Adoption Explained: How Blackrock, Fidelity and Others Embraced BTC (The Block, undated in feed): link
- [T5] Crypto ETFs Enter a New Phase in September: Here’s What Investors Should Watch (Bitcoin Foundation, undated in feed): link
- [T6] Bitcoin ETF inflows return as US crypto legislation faces delays (crypto.news, November 2026): link
- [T7] Bitcoin’s Evolving Institutional Role (ARK Invest, February 2026): link
- [T8] $1 Billion Flows Out of Bitcoin ETFs as Midterm Elections Put Trump’s Crypto Agenda to the Test (TradingView News / Benzinga, undated in feed): link
Methodology note
Market data was retrieved on 2026-11-08 at 05:15 UTC. News items are contextual and dated where stated; several are undated in the feed and are flagged accordingly. Where a news item conflicts with the authoritative policy rates block (for example, T7’s February 2026 description of a Fed rate-cutting cycle in “early innings”), the policy rates block governs and the news figure is treated as a dated claim. Scenario price levels are illustrative assumptions derived from drawdown arithmetic, not forecasts or price targets.
This report is AI-generated and is provided for informational purposes only. It does not constitute investment advice, a recommendation, or an offer to buy or sell any financial instrument. Readers should conduct their own research and consult a licensed financial advisor before making investment decisions.
Important Note / Wichtiger Hinweis:
EN: This report may have been generated using AI. It processes data from publicly available sources. The content is provided for informational purposes only.DE: Dieser Bericht kann mithilfe von KI erstellt worden sein. Dabei werden Daten aus öffentlich zugänglichen Quellen verarbeitet. Die Inhalte dienen ausschließlich Informationszwecken.