
Listen to the summary
Key Data Snapshot
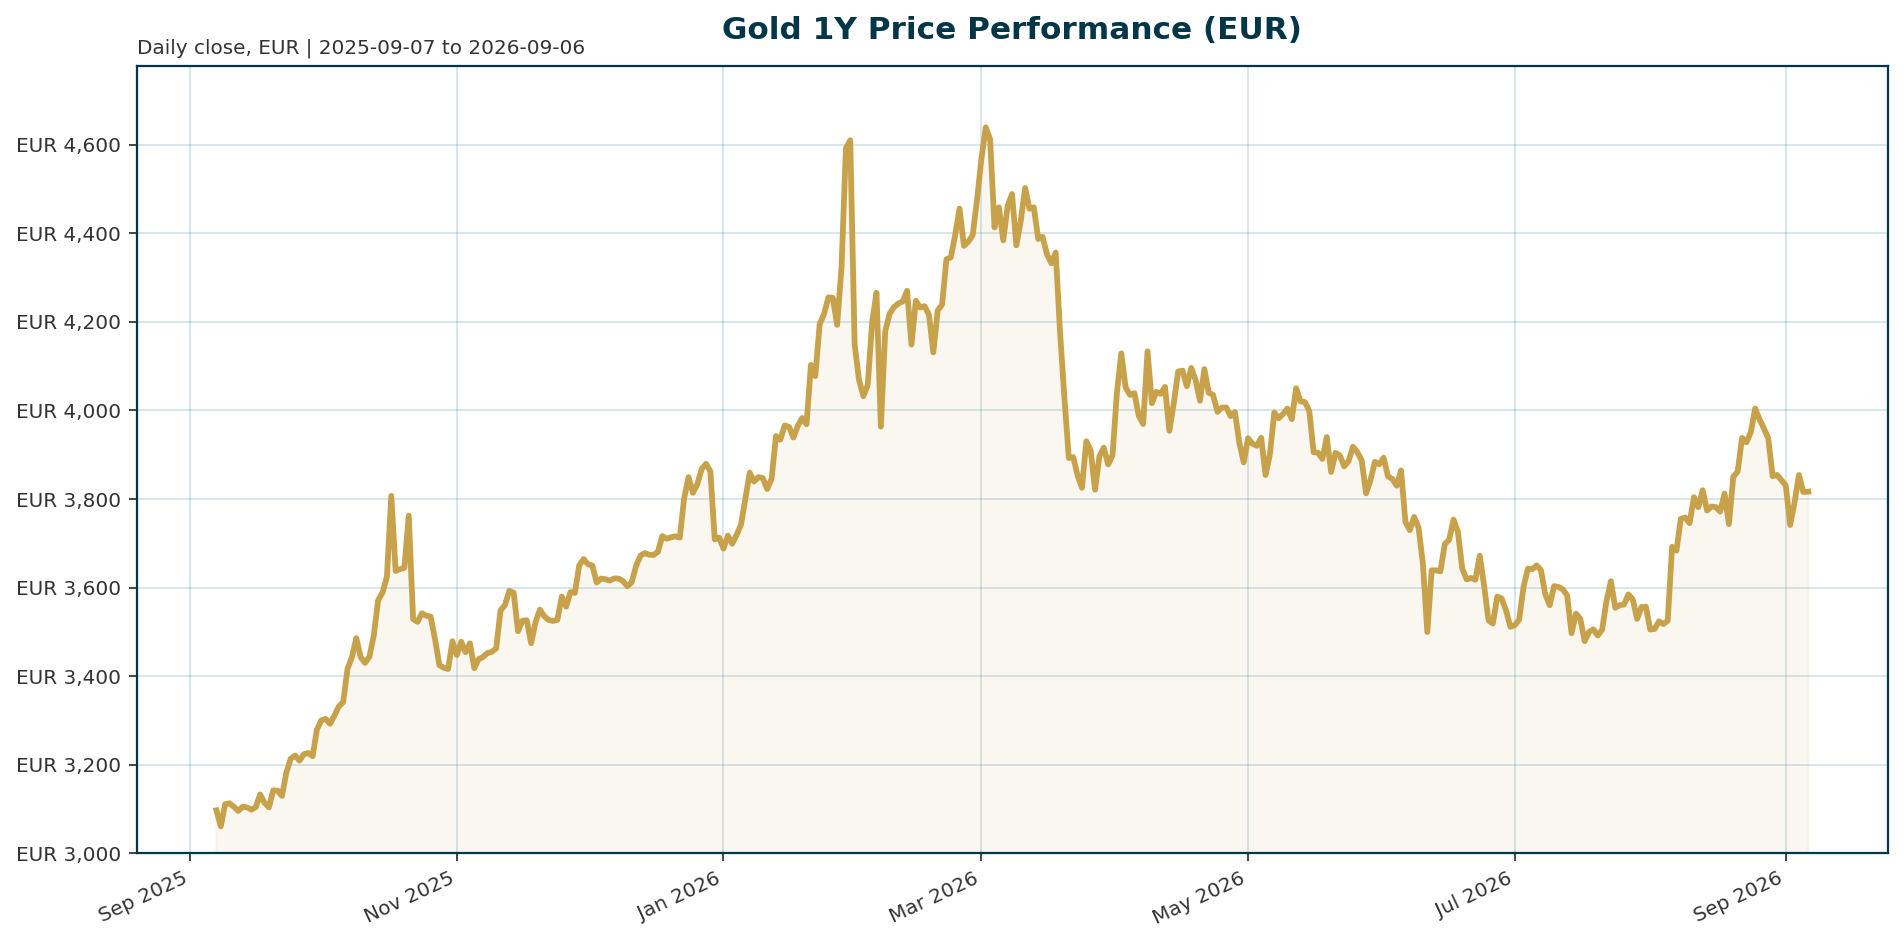
| Asset | Price (EUR) | 24h Change | 7D Change | 30D Change | YTD Change | Market Cap |
|---|---|---|---|---|---|---|
| Gold (XAU) | 3,816.45 | -0.05% | -0.70% | +4.50% | +23.30% | 1.65B |
Gold currently trades 18.6% below its January 2026 all-time high of 4,688.32 EUR, reflecting a consolidation phase following a strong 23.3% year-to-date rally. The asset is trading within a tight intraday range of 3,813.56 to 3,819.01 EUR, indicating low volatility and a balanced short-term outlook.
Macro Backdrop
Risk sentiment is neutral with mixed equity flows across global benchmarks. The Euro area rates backdrop is mixed, with the 10-year yield holding steady at 3.36% while the 2-year yield has risen 22.3 basis points over the past month. The FX landscape is mixed, with EUR/USD strengthening 0.30% over five days to 1.1628. Key observations include the ATX leading regional performance at 2.30% over one month and the Nikkei 225 lagging with a 1.95% decline over five days. This complex environment places gold at a macro inflection point where traders are watching PCE data to decipher the Federal Reserve’s next move [T1][T6].
Investment Thesis
The primary thesis for gold centers on a structural decoupling from traditional real yield models. Societe Generale argues that a “post-2022 regime shift” has occurred, where gold maintains strength despite persistently positive real yields [T3][T7]. The fundamental driver is the shift in reserve management, where central bank buying provides a structural floor that absorbs supply and reduces sensitivity to short-term rate expectations [T4][T8]. The market is pricing in a new normal where geopolitical uncertainty, dedollarization trends, and sovereign debt concerns provide a higher baseline for prices, limiting the downside impact of elevated real rates [T3].
Bullish Drivers
- Central Bank Accumulation: A record 43% of global monetary authorities plan to increase their gold reserves over the next year, driven by geopolitical risks and sanctions vulnerability [T8].
- Dedollarization Trends: Emerging markets are actively diversifying away from the US dollar, providing consistent demand that supports the price floor [T4][T7].
- Real Yield Resilience: Despite 10-year TIPS real yields sitting around 2%, gold has continued to trade near record highs, suggesting the market has priced in a higher baseline for the metal [T2][T8].
- Geopolitical Risk Premium: Energy price volatility and ongoing geopolitical tensions complicate the inflation outlook, supporting gold as a hedge against policy uncertainty [T6][T5].
Relative Positioning vs Bitcoin and Ethereum
Gold maintains a dominant position within the broader asset class hierarchy. With a market cap of approximately 1.65 billion EUR, gold dwarfs individual crypto assets. Compared to the total crypto market cap of 2.31 trillion EUR, gold represents a significant portion of the safe-haven liquidity pool. While Bitcoin holds 59.2% dominance within the crypto sector, gold serves as the “blue chip” of safe assets, offering superior liquidity and stability compared to the high-beta nature of Ethereum. In risk-on environments, crypto assets may outperform, but in risk-off scenarios, gold acts as the primary liquidity sink, outperforming digital assets.
Scenario Framework
- Base Case: The Federal Reserve delivers two 25 basis point cuts in September and December, normalizing real yields to 1.5% to 2.0%. Gold holds its current level and consolidates around the 3,800 EUR mark.
- Bullish Case: Inflation proves sticky, forcing the Fed to delay cuts or hike further. Real yields spike, but central bank buying and dedollarization demand push gold toward USD 5,000, supported by a weaker dollar [T5][T3].
- Bearish Case: A sharp inflation shock triggers a rapid rise in real yields above 3%. The US dollar strengthens significantly, putting pressure on EUR-denominated gold and triggering a correction toward the 3,500 EUR level.
Valuation Discussion
Current valuations appear reasonable given the structural shift in demand. The 18.6% drawdown from the January ATH serves as a healthy correction rather than a valuation disconnect. Real yields are high by historical standards but remain within the band where gold has historically compounded [T2]. Societe Generale suggests the all-time high of 4,688.32 EUR may now represent a new lower bound due to the structural support provided by central bank demand and geopolitical risks [T3].
Risks
- Real Yield Shock: A rapid rise in nominal yields, driven by sticky inflation, would increase the opportunity cost of holding gold, triggering a sharp correction [T1][T6].
- USD Rally: A stronger US dollar makes EUR-denominated gold more expensive for international buyers, dampening demand [T3].
- ETF Outflows: While central banks are buying, ETF inflows have moderated sharply this year. A sudden shift in investor sentiment toward risk assets could lead to profit-taking and increased volatility [T3][T6].
Appendix
Sources
- Gold approaches macro inflection as PCE data tests Fed outlook [T1]
- Central Banks Are Snapping Up Gold, ETF Investors Are Just Waking Up [T2]
- It’s time to get bullish on gold again, says SocGen [T3]
- Gold suffers worst quarter in 13 years amid interest rate hike fears [T4]
- Gold looks beyond war as inflation, monetary policy steer prices [T5]
- Geopolitics alone isn’t enough to lift gold [T6]
- Gold’s Dual Drivers: Central Bank Flows and Real Yields [T7]
- Is it a golden era for gold? [T8]
This report is AI-generated for informational purposes only and does not constitute investment advice. Always conduct your own research before making investment decisions.
Important Note / Wichtiger Hinweis:
EN: This report may have been generated using AI. It processes data from publicly available sources. The content is provided for informational purposes only.DE: Dieser Bericht kann mithilfe von KI erstellt worden sein. Dabei werden Daten aus öffentlich zugänglichen Quellen verarbeitet. Die Inhalte dienen ausschließlich Informationszwecken.
* DE: Die ergänzenden Inhalte können KI-generiert sein. EN: The additional content may be AI-generated.