
The altii-Gold-Report: Gold (XAU) in EUR
Date: 27 September 2026 | Instrument: Gold (XAU), quoted in EUR | Snapshot: 3,755.28 EUR/oz
Listen to the summary
Key Data Snapshot
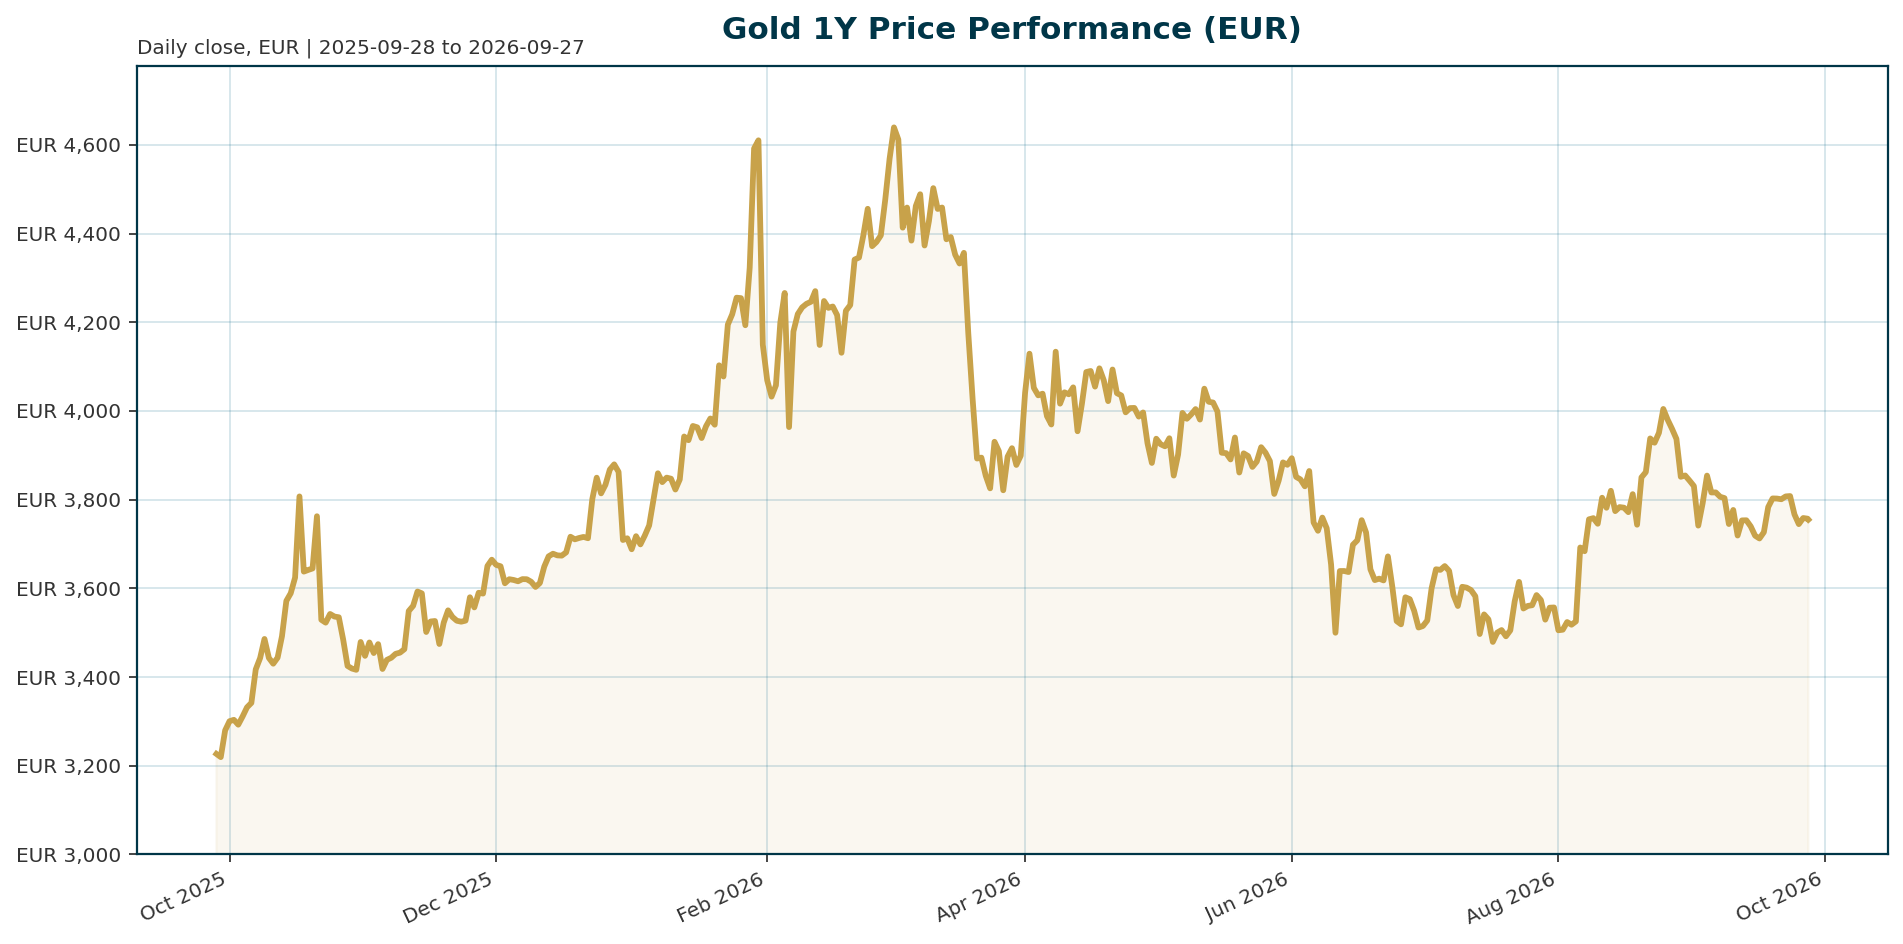
| Metric | Value | Context |
|---|---|---|
| XAU/EUR price | 3,755.28 EUR | 24h high/low: 3,759.09 / 3,753.58 |
| 24h change | -0.08% | 1h: -0.05% |
| 7d change | -1.90% | 14d: -1.80% (stabilizing mid-window) |
| 30d change | -6.57% | Cyclical drawdown phase |
| 200d change | -18.02% | Deepest rolling window in the set |
| 1y change | +13.21% | Structural trend intact |
| All-time high (EUR) | 4,688.32 EUR (28 Jan 2026) | Current: -19.90% below |
| All-time low (EUR) | 1,265.28 EUR (17 Nov 2019) | Current: +196.79% above |
| Euro AAA 10Y yield | 3.57% | +3.6bp 5d, +32bp 1m, +62bp YTD |
| Euro AAA 2Y yield | 3.23% | +112bp YTD; 10Y-2Y spread: 33.7bp |
| EUR/USD | 1.1398 | -0.38% 5d, -2.15% 1m, -3.00% YTD |
| Tokenized supply / market cap | 434,899 units / 1.63bn EUR | 24h volume: 36.8m EUR (thin vs LBMA) |
| BTC dominance | 58.33% | Total crypto market cap: 2,547bn USD |
Snapshot read: EUR-quoted gold is in a cyclical drawdown (-18% over 200 days, -19.9% from the January peak) inside a longer structural uptrend (+13.2% y/y, +196.8% from the 2019 low). The 14d change (-1.80%) sitting above the 7d change (-1.90%) suggests the selling pace has eased, not accelerated. Price data reflect the tokenized instrument (PAXG class), so short-horizon moves may carry token-specific noise; treat them as directionally representative of spot gold, not a perfect LBMA proxy.
Macro Backdrop
Market context: Overall risk sentiment is neutral and equity momentum is mixed. On a 5-day view the Nikkei 225 leads at +3.82% while the Hang Seng lags at -2.13%; the Nasdaq Composite is the strongest 1-month performer at +3.59%. DACH indicators are broadly in line with global peers, averaging -0.01% over 5 days versus +0.31% globally. The rates backdrop shows mixed euro yields with the AAA 10Y at 3.57%, and the FX backdrop is mixed with EUR/USD at 1.1398 after a -0.38% 5-day move and EUR/CHF posting the strongest 5-day FX move at +0.35%. None of this signals an acute risk-off or risk-on impulse; gold’s drivers currently sit in policy and reserve flows rather than cross-asset rotation. These conditions are context, not the core of the gold case.
US policy and inflation: The Federal Reserve cut 75 basis points over the past six months, with the upper bound now at 3.75%, and has held for five months [T1]. ING reports the Fed left rates unchanged at its most recent meeting, with Chair Powell requiring clearer progress on inflation before further easing, although ING’s US economist still expects two 25bp cuts later this year, in September and December [T3]. Lombard Odier likewise sees the Fed on hold for much of 2026 with any cut more likely toward year-end [T8]. One source framed markets as pricing only modest additional tightening below the Atlanta Fed’s Taylor Rule prescription, implying inflation risk remains underpriced [T2]; note this claim predates the current holding pattern and should be read as an early-September view. US CPI sits at 332.4 on the FRED index, in the 91st percentile of its 12-month range, and the 10-year TIPS real yield is around 2%, high by recent standards but inside the band where gold has historically compounded [T1]. Rising energy prices tied to geopolitical tension complicate the disinflation path; ING flags that a higher-for-longer environment would keep real yields elevated and pressure gold, while a stagflationary mix would support it over the longer term [T3].
Euro-area rates, the EUR-quoted opportunity cost: Euro AAA yields have repriced sharply higher: the 2Y is up 112bp YTD, the 10Y up 62bp YTD to 3.57%, with a 33.7bp 10Y-2Y spread. Because this report measures gold in EUR, rising euro nominal yields directly raise the opportunity cost of holding the metal for euro-based investors. The bundle contains no euro-area breakeven inflation data, so the euro-area real yield cannot be computed precisely; directionally, the front-end repricing is a EUR-specific headwind. Currency is the second mechanical drag: EUR/USD is down 3.00% YTD, meaning the euro has appreciated against the dollar and compressed the EUR-quoted price relative to USD gold, which ING reports as up roughly 6% YTD (undated claim, reconcile with care) [T3].
Fiscal and debt backdrop: Public debt-to-GDP ratios in many advanced economies are at or near post-war highs. History suggests such debt burdens are often resolved through financial repression, inflation, or currency depreciation, all scenarios in which gold tends to outperform [T5].
Investment Thesis
The core thesis is a post-2022 regime shift. Gold has continued to trade near record highs despite persistently positive real yields, breaking away from historical models that would imply significantly lower prices. Société Générale attributes this to structural factors: sustained central bank purchases, dedollarisation trends, geopolitical uncertainty, and sovereign debt concerns providing a higher price floor that limits the downside impact of elevated real rates [T2]. The bank frames the market as a dual-driver system: central bank flows as the structural backstop and real yields as the cyclical swing factor, with official-sector buying reducing gold’s sensitivity to short-term rate expectations [T4].
The demand-side evidence is concrete. Central banks accumulated an average of roughly 1,000 tonnes per year over the past four years, double the 500-tonne average of the preceding decade, according to the World Gold Council’s 2026 survey of 76 monetary authorities, the highest participation in its nine-year history [T6]. A report citing reserve data indicates central banks now collectively hold more gold than US Treasuries [T5]. Forward intent confirms persistence: a record 43% of 73 surveyed monetary authorities expect their own gold reserves to increase over the next year [T7]. In EUR terms, the 1-year return of +13.21% confirms the structural trend persists through the current -19.9% drawdown from the January peak.
On the cyclical side, ING notes gold is up roughly 6% YTD in USD, leaving the market vulnerable to profit-taking, but argues that any deeper pullback would likely attract central bank and longer-term buyers [T3]. The thesis therefore holds if official-sector demand stays near the 1,000t annual pace and real yields do not spike sharply; SocGen explicitly cautions that a sharp monetary reversal driving real yields rapidly higher is the key headwind [T4]. The thesis weakens if central bank buying slows, which ING also flags as possible, while euro yields continue climbing [T3].
Bullish Drivers
1. Reserve diversification and de-dollarisation. Emerging-market central banks are diversifying reserves away from the US dollar for sanctions resilience, a trend SocGen describes as showing no signs of abating [T4]. Nations near geopolitical fault lines, including those bordering the Russia-Ukraine war, are increasing gold reserves, and governments not aligned with the US seek reserve mixes less vulnerable to sanctions measures [T7]. Among EMDE institutions, 95% cite geopolitical instability as a key allocation driver, versus 67% in advanced economies [T6].
2. Record official-sector intent. The WGC survey shows 92% of respondents flag interest rates, 90% cite gold’s crisis performance as highly relevant following the Middle East escalation, and the purchase average has doubled to roughly 1,000t over four years [T6]. JPMorgan’s survey shows a record 43% of monetary authorities expect to add to reserves [T7]. At an illustrative 3,755.28 EUR/oz, one tonne is worth approximately 120.8m EUR (32,150.7 oz x 3,755.28), so a sustained 1,000t annual pace implies roughly 121bn EUR of official-sector demand per year, a scale that consistently absorbs mine and recycled supply.
3. Fiscal dominance and financial repression risk. Post-war-high debt ratios make financial repression, inflation, and currency depreciation the historical resolution paths, all gold-positive [T5]. Sustained moves toward negative real rates would be a powerful structural tailwind.
4. Underpriced inflation risk. Markets have at times priced monetary policy below the Atlanta Fed’s Taylor Rule prescription, implying inflation risk premia remain compressed; gold is the natural hedge if that repricing occurs [T2]. CPI in the 91st percentile of its 12-month range confirms inflation has not gone away [T1].
5. Stagflation hedge and ETF flow optionality. A mix of slower growth and persistent inflation is supportive of gold over the longer term [T3]. Gold ETF inflows have moderated sharply this year but remain positive [T2], and retail ETF demand is described as only now waking up [T1]. If ETF investors re-enter while official buying persists, the demand base broadens beyond the central-bank floor, historically the strongest configuration for the metal.
Bearish counterweight: these drivers are structural, not momentum. With EUR-quoted gold down 6.57% over 30 days, none of them has prevented the current consolidation; they define the floor, not the next leg.
Relative Positioning vs Bitcoin and Ethereum
The bundle lacks asset-level BTC and ETH prices, so this comparison is role-based rather than ratio-based; a precise gold/BTC ratio is unavailable. Aggregate data frame the contrast: total crypto market capitalization stands at approximately 2,547bn USD with 24h volume of 50.05bn USD, and Bitcoin dominance at 58.33% indicates no broad altcoin rotation is underway. The tokenized gold instrument itself is small at 1.63bn EUR market cap and 36.8m EUR 24h volume, a scale comparison only, not a measure of the physical gold market.
The positioning argument rests on driver quality and vol profile. Gold’s 1-year return of +13.21% in EUR was achieved with the demand floor of official-sector buying and is being defended by it during the current drawdown [T3]. SocGen notes gold’s lower volatility improves its appeal to longer-term reserve managers rather than short-term momentum traders [T2], and 90% of central banks cite the metal’s crisis performance as a core allocation rationale [T6]. Bitcoin and Ethereum offer no official-sector bid, higher volatility, and equity-correlated behavior; the mixed equity tape (Nasdaq +3.59% over 1 month, Hang Seng -2.13% over 5 days) confirms crypto remains tied to risk-asset cycles. In a risk-off scenario, gold draws safe-haven flows while BTC and ETH typically underperform; with BTC dominance above 58%, the crypto complex currently offers neither a haven signal nor a rotation signal. In a liquidity-driven risk-on melt-up, crypto can outperform gold short term, but gold’s structural bid limits gap-down risk in ways crypto cannot match. For reserve-style and euro-based allocators, gold remains the higher-quality diversifier; crypto remains the higher-beta satellite.
Scenario Framework
Base case (probability-weighted center): Fed on hold, cuts late in the year, central-bank floor intact. Triggers: Fed holds for much of 2026 with a cut more likely toward year-end [T8], consistent with ING’s two-cut September/December expectation [T3] and the five-month holding pattern at a 3.75% upper bound [T1]. Real yields stay near 2%, inside the band where gold has historically compounded [T1]. Official buying persists near 1,000t annually [T6]. Implication: EUR gold ranges sideways to modestly higher; drawdowns are bought by the official sector and long-term investors [T3]; the 30d decline of -6.57% fades rather than extends. Euro yield drift remains a drag on EUR-quoted returns.
Bull case: dovish pivot plus flow reacceleration. Triggers: faster cuts than Lombard Odier expects, ETF inflows reaccelerating from their moderated 2026 pace [T2], and fiscal-repression narratives strengthening as debt debates intensify [T5]. Real yields drift toward zero or negative territory, historically the most powerful structural tailwind. Implication: the January ATH of 4,688.32 EUR comes back into range over a 6-12 month horizon; external USD targets as high as 5,000 USD/oz circulate in promotional coverage [T1], which this report notes without endorsement. EUR-quoted upside is amplified if the euro gives back part of its YTD appreciation.
Bear case: hawkish repricing plus slowing official buying. Triggers: energy-driven inflation persistence forces a higher-for-longer stance [T3], a sharp monetary reversal lifts real yields rapidly [T4], and central bank accumulation decelerates [T3]. Implication: the structural floor compresses, EUR strength adds FX drag on top, and the 200d downtrend (-18.02%) extends toward a deeper test. A stagflationary mix is the partial offset: ING argues it remains supportive of gold over the longer term even as near-term real yields bite [T3].
Valuation Discussion
Two valuation lenses give conflicting answers, and both should be stated plainly.
Model lens (real-yield regression): expensive. Historical models calibrated to the gold-real-yield relationship imply significantly lower prices at current real yields of around 2% on the 10-year TIPS [T1, T2]. On this framework, EUR-quoted gold at 3,755.28 trades at a premium to model-implied value, and the January peak of 4,688.32 EUR was an extrapolation beyond what rate levels alone justify.
Flow/floor lens (reserve demand): reasonable at cyclical support. The post-2022 regime shift means the market now prices fundamental shifts in global reserve management rather than speculative flows [T4]. With official buying near 1,000t annually [T6], central banks holding more gold than Treasuries [T5], a record 43% of monetary authorities intending to add [T7], and the price 19.9% below its EUR ATH after a -6.57% 30d move, the metal sits near the zone where official and long-term buyers have historically stepped in [T3]. On this lens the current level is reasonably valued, not cheap.
FX decomposition (derived calculation): EUR-quoted returns approximate USD gold returns minus euro appreciation. Implied USD price: 3,755.28 x 1.1398 = approximately 4,280 USD/oz (derived, not sourced). Against ING’s report of USD gold up roughly 6% YTD [T3], the EUR-quoted YTD performance is materially lower partly because EUR/USD has fallen 3.00% YTD (euro stronger). Rough decomposition: if USD gold gained approximately 6% while the euro appreciated approximately 3% versus the dollar YTD, the EUR-quoted gain of roughly 3% is arithmetically consistent. This is an approximation using mismatched windows and should be treated as indicative. A second derivation: if EUR/USD retraced to its YTD starting level, EUR-quoted gold would recover roughly 3% with no move in USD gold at all.
Distance checks: 3,755.28 / 4,688.32 – 1 = -19.90% from ATH; 3,755.28 / 1,265.28 – 1 = +196.79% from ATL. Both match the bundle. Missing data: euro-area breakeven inflation is unavailable, so euro-area real yields cannot be computed; the 10Y nominal of 3.57% is the best available anchor.
Verdict: on balance, EUR gold after a -18% 200d drawdown looks reasonably valued on the flow lens that has governed pricing since 2022, with the model lens a standing warning that a sharp real-yield rise would close the gap from above. Neither lens supports chasing here; both support accumulation on further weakness.
Risks
1. Hawkish policy surprise. A sharp monetary reversal driving real yields rapidly higher is SocGen’s explicit caution [T4]. A higher-for-longer environment keeps real yields elevated and pressures gold [T3]. Lombard Odier sees restrictive-Fed risk as limited but non-zero [T8]. Watch: energy-price impulses that delay disinflation [T3].
2. Slowing central bank buying. ING flags that official purchases may slow [T3]; the 1,000t pace is behavioral, not contractual. A pause by major Asian or Middle Eastern reserve holders would undermine the floor narrative.
3. Profit-taking after YTD gains. Gold up roughly 6% YTD in USD leaves the market vulnerable to bouts of profit-taking [T3]. The -6.57% 30d move in EUR terms may be an early expression of this.
4. Euro-area yield climb and EUR strength. The AAA 10Y is up 62bp YTD, raising the euro-denominated opportunity cost, and further euro appreciation would mechanically depress EUR-quoted prices independently of USD gold.
5. ETF outflow risk. Inflows have moderated sharply this year [T2]; a turn to outflows would remove the second marginal buyer just as official buying slows.
6. Mitigant. Deeper pullbacks have historically attracted central bank and long-term buyers, capping tail risk [T3]. The combination of hawkish surprise and EM central-bank pause is the genuine tail scenario; it is possible but requires both legs to fire simultaneously.
7. Data and measurement risk. Pricing derives from the tokenized instrument (PAXG class); 24h volume of 36.8m EUR is thin relative to LBMA, so short-horizon returns may embed token-specific noise. Several news items are undated and one source URL appears malformed; claims have been attributed with their publication context where identifiable.
Appendix
Methodology and data notes: Price and performance data come from a tokenized gold instrument (CoinGecko id: pax-gold) quoted in EUR: circulating and total supply of 434,898.62 units, market cap of approximately 1.63bn EUR, fully diluted valuation equal to market cap, no maximum supply. This is an instrument metric, not a measure of the physical gold market. Euro-area rates reference the ECB AAA yield curve as of 24 September 2026; FX references the Frankfurter service as of 27 September 2026. The market overview reflects equity data as of 25 September 2026.
Key calculations:
- Implied USD gold price: 3,755.28 EUR x 1.1398 (EUR/USD) = approximately 4,280 USD/oz (derived).
- ATH distance: (3,755.28 / 4,688.32) – 1 = -19.90%. ATL distance: (3,755.28 / 1,265.28) – 1 = +196.79%.
- FX decomposition of YTD performance: approximated as USD gold return (~6% per ING [T3], undated) minus euro appreciation (~3% YTD), yielding roughly +3% EUR-quoted YTD; indicative only, windows do not align exactly.
- Illustrative official-sector demand notional: 1,000t x 32,150.7 troy oz/t x 3,755.28 EUR/oz = approximately 121bn EUR per year.
- Central bank purchase acceleration: ~1,000t average over four years versus ~500t average over the prior decade, a doubling [T6].
- Euro-area real yield: not computable; breakeven inflation data unavailable in the bundle.
Glossary of drivers: Real yields: inflation-adjusted interest rates; the opportunity cost of holding a non-yielding asset like gold [T7]. Taylor Rule: a policy-rate benchmark; policy below its prescription implies underpriced inflation risk [T2]. Financial repression: policies holding real rates below inflation to erode debt burdens, historically gold-positive [T5]. De-dollarisation: the shift of reserve assets away from the US dollar toward gold and alternatives for sanctions resilience [T4, T7].
Data caveats: The ATH of 4,688.32 EUR (28 January 2026) is EUR-quoted and may not coincide with the USD-quoted gold ATH. The ING claim that gold is up roughly 6% YTD is in USD and undated in the source; it may not align with the 27 September 2026 snapshot. Several news items lack publication dates and should be treated with appropriate staleness caution.
Sources
- [T1] Central Banks Are Snapping Up Gold, ETF Investors Are Just Waking Up: The Best Gold ETFs to Own Before It Hits $5,000 – 24/7 Wall St.
- [T2] It’s time to get bullish on gold again, says SocGen | Kitco News
- [T3] Geopolitics alone isn’t enough to lift gold | ING THINK
- [T4] Gold’s Dual Drivers: Central Bank Flows and Real Yields, According to Societe Generale | CryptoRank.io
- [T5] Report: Central Banks Now Hold More Gold Than Treasuries – CEOWORLD magazine
- [T6] Central Bank Gold Purchases Hit 1000t Average – Mexico Business News (WGC Survey)
- [T7] Is it a golden era for gold? | J.P. Morgan Private Bank
- [T8] Gold’s slowdown doesn’t signal a reversal | Lombard Odier
Disclaimer: This report is AI-generated and provided for informational purposes only. It does not constitute investment advice, a recommendation, or an offer to buy or sell any financial instrument. Data may be incomplete, delayed, or subject to error. Readers should conduct their own research and consult a licensed financial advisor before making investment decisions.
Important Note / Wichtiger Hinweis:
EN: This report may have been generated using AI. It processes data from publicly available sources. The content is provided for informational purposes only.DE: Dieser Bericht kann mithilfe von KI erstellt worden sein. Dabei werden Daten aus öffentlich zugänglichen Quellen verarbeitet. Die Inhalte dienen ausschließlich Informationszwecken.
* DE: Die ergänzenden Inhalte können KI-generiert sein. EN: The additional content may be AI-generated.