
Listen to the summary
Key Data Snapshot
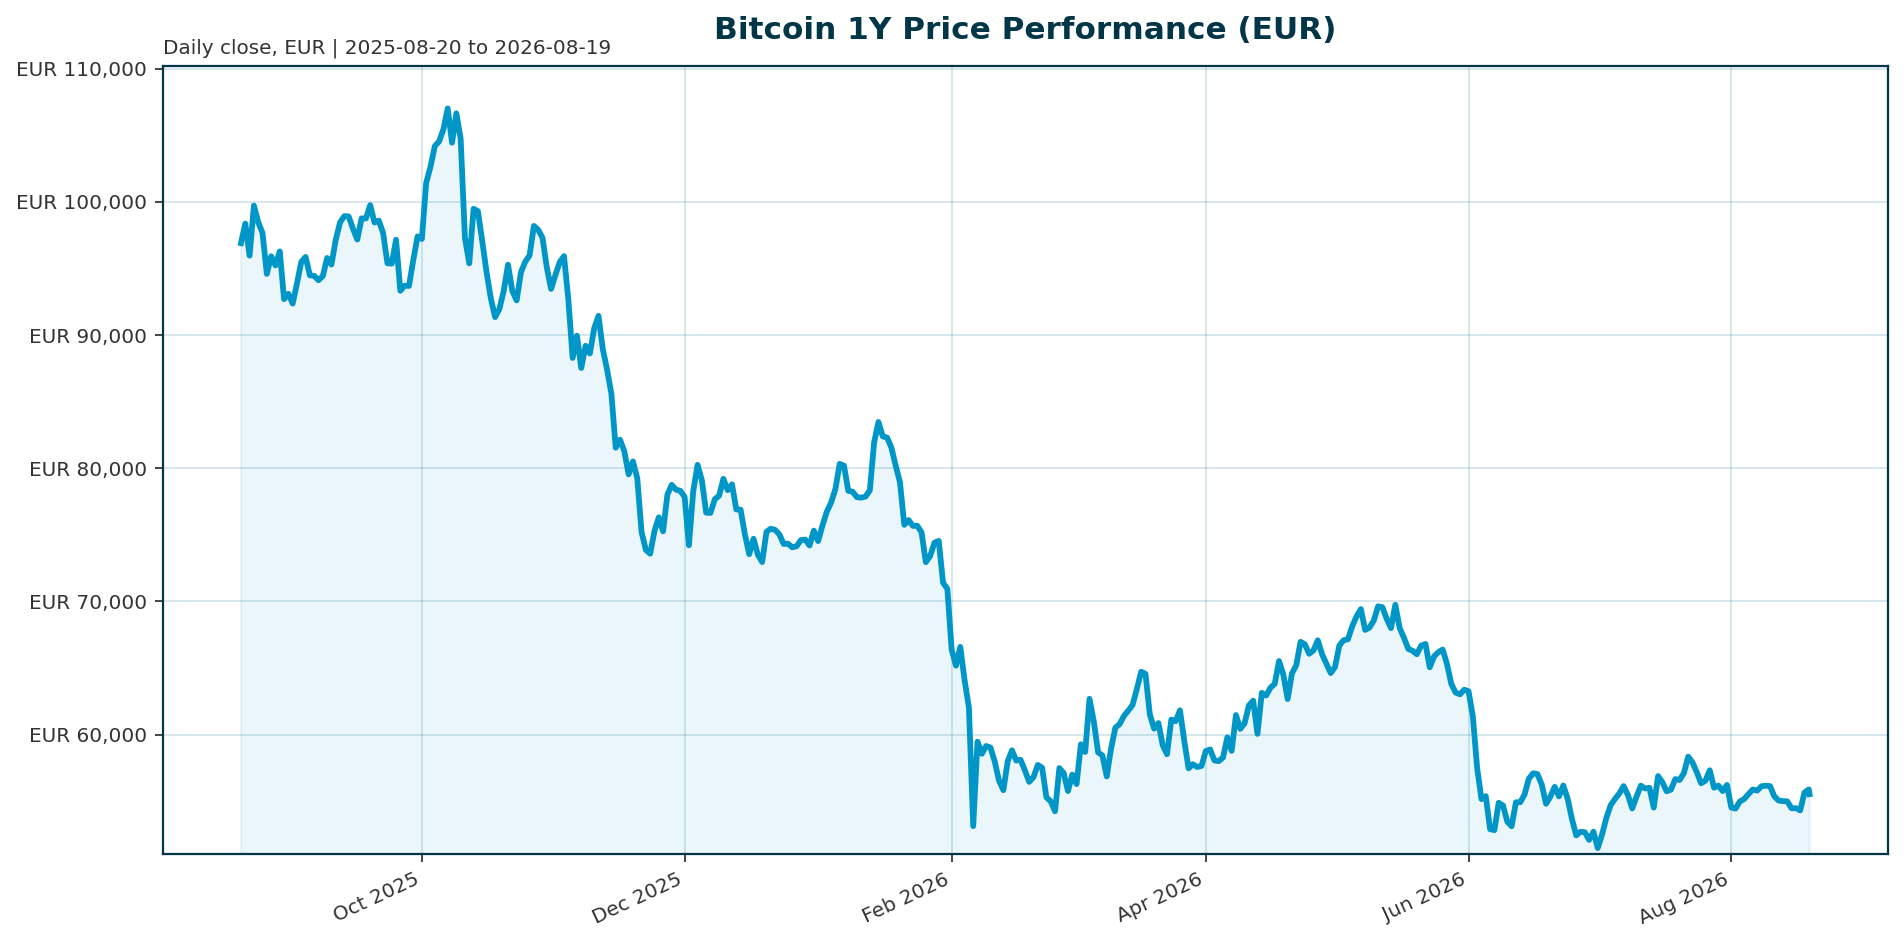
| Metric | Value |
|---|---|
| Price (EUR) | 55,499.00 |
| 24h Change | +0.30% |
| Market Cap (EUR) | 1.11T |
| 200d Change | -23.50% |
| All-Time High (ATH) | 107,662.00 (Oct 2025) |
| ATH Change | -48.45% |
| BTC Dominance | 56.51% |
Market Setup
The macro backdrop remains the primary variable for Bitcoin. Risk sentiment is neutral to positive, with equity momentum showing mixed signals. The DAX leads on a 1-month basis at 5.22%, while the Nikkei 225 is the weakest performer at -3.88%. The Euro area AAA 10Y yield sits at 3.24%, moving 6.6 basis points higher over the last five days, creating a frictional environment for risk assets. FX markets are mixed, with EUR/USD gaining 0.18% over 5 days. This environment suggests Bitcoin faces headwinds from higher yields but finds support in the broader neutral risk sentiment.
Investment Thesis
Bitcoin has transitioned from a speculative curiosity to a regulated financial instrument. The primary driver of value is now institutional capital allocation via ETFs and macro liquidity, rather than the traditional halving cycle. According to recent analysis, ETF flows effectively became Bitcoin’s new macro indicator in 2025, with regulated investment vehicles and digital asset treasury structures integrating it closer with traditional financial markets [T3]. The market structure has fundamentally shifted, where ETFs now dominate price discovery approximately 85% of the time, making them the primary transmission mechanism between institutional capital allocation and spot prices [T7].
Bullish Drivers
- Structural Supply Deficit: Institutional demand is surpassing new supply. Analysis from 2025 shows institutions accumulated 545,579 BTC while miners produced only 97,082 BTC during comparable timeframes, a ratio of 5.6x [T7].
- ETF Flow Dynamics: Renewed ETF inflows exceeding mining supply could restore favorable supply-demand dynamics. An optimistic scenario envisions inflows reaching 2-3 times daily production, potentially pushing Bitcoin above $125,000 resistance toward the $140,000-$160,000 range by mid-2026 [T7].
- Regulatory Catalysts: The CLARITY Act could establish a federal market-structure framework for digital assets, potentially unlocking broader institutional participation if passed [T1].
- Market Maturity: Bitcoin has become less volatile, with volatility decreasing from 84% to 43%, indicating it is evolving into a more stable, institutional asset [T3].
Relative Positioning vs Gold and Ethereum
vs. Gold: While Gold typically serves as a safe haven during periods of high rates, Bitcoin is increasingly behaving as a risk-on asset correlated with liquidity conditions. The current drawdown of 48.45% from ATH contrasts with Gold’s defensive profile, but the thesis argues Bitcoin is becoming an allocatable line item for institutions rather than a pure hedge [T2][T6].
vs. Ethereum: Ethereum competes for capital within the regulated ETF ecosystem. However, Bitcoin’s dominance of 56.51% suggests it remains the primary vehicle for institutional capital rotation. As noted in the Q2 2026 Digital Asset Review, pure Bitcoin ETF plays a smaller strategic role in Asia compared to tokenization and stablecoins, but in the broader institutional landscape, BTC remains the flagship asset [T1].
Scenario Framework
- Base Case: The Federal Reserve holds rates through Q3 under Chair Kevin Warsh. ETF flows remain stable but do not exceed mining supply. Bitcoin consolidates in the 50,000 EUR to 60,000 EUR range.
- Bull Case: Regulatory clarity improves via the CLARITY Act or macro easing occurs. ETF inflows resume at levels exceeding mining supply. Bitcoin breaks above $125,000 resistance and extends to new all-time highs in the $140,000-$160,000 range [T7].
- Bear Case: A prolonged high-rate environment or regulatory reversal causes ETF outflows. The negative feedback loop between outflows and price weakness triggers a test of lower support levels.
Valuation Discussion
Bitcoin is currently trading at a significant discount to its October 2025 ATH of 107,662 EUR, down 48.45% [T2]. This valuation reflects the “higher for longer” rate environment and post-halving correction. However, the structural supply constraint (max 21M BTC) remains the anchor. The maturation of the market, evidenced by lower volatility and the dominance of ETF flows in price discovery, suggests the asset is pricing in current macro headwinds. Valuation appears attractive relative to the structural supply deficit, provided liquidity conditions do not deteriorate further.
Risks
- Macro Liquidity: The Euro area AAA 10Y yield is at 3.24% and rising. A prolonged high-rate environment could suppress risk asset valuations [T1][T2].
- Flow Reversal: ETF outflows remain a critical risk. Record outflows in Q4 2025 coincided with Bitcoin breaking key support levels, proving the sensitivity to regulated capital movement [T3].
- Regulatory Uncertainty: While the CLARITY Act is a potential catalyst, regulatory crackdowns or changes in tax treatment could widen participation gaps for institutions on the sidelines [T1][T5].
Appendix
Sources:
- Q2 2026 Digital Asset Review [T1]
- Bitcoin Holds Near $80K–$81K as ETF Inflows Revive Bullish Sentiment [T2]
- Crypto Market 2025: Year-End Review & Expert Insights [T3]
- BlackRock Bitcoin ETF Achieves Staggering $935M Q1 Inflow Milestone [T4]
- Bitcoin and Ether ETF Inflows Rebound [T5]
- Bitcoin Price Prediction 2026: Institutional Adoption & ETF Impact [T6]
- Why Bitcoin ETF Demand Now Trails Daily Mining Supply [T7]
- Bitcoin Price Faces a Pivotal Shift: New Market Structure [T8]
Disclaimer: This report is AI-generated for informational purposes only and does not constitute investment advice. The views expressed are those of the AI assistant and should not be taken as financial recommendations. Always conduct your own research before making investment decisions.
Important Note / Wichtiger Hinweis:
EN: This report may have been generated using AI. It processes data from publicly available sources. The content is provided for informational purposes only.DE: Dieser Bericht kann mithilfe von KI erstellt worden sein. Dabei werden Daten aus öffentlich zugänglichen Quellen verarbeitet. Die Inhalte dienen ausschließlich Informationszwecken.
* DE: Die ergänzenden Inhalte können KI-generiert sein. EN: The additional content may be AI-generated.