
Listen to the summary
Key Data Snapshot
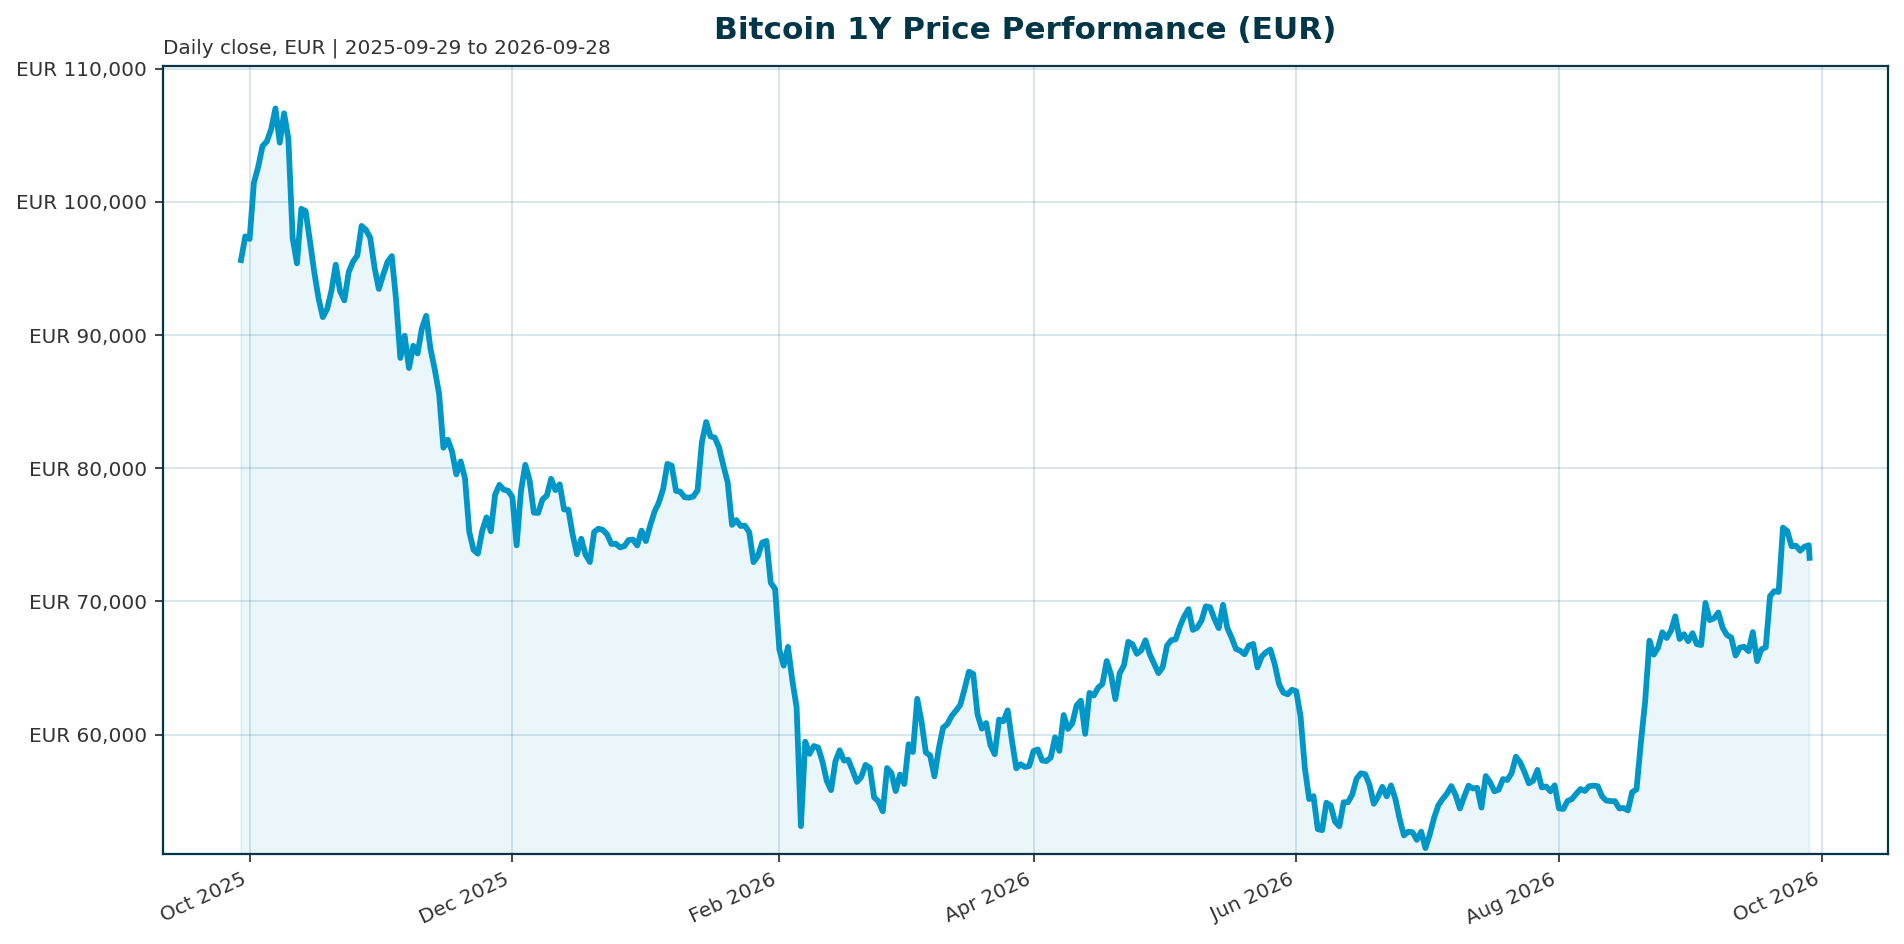
| Metric | Value | Comment |
|---|---|---|
| Price (EUR) | EUR 73,230 | 24h range EUR 73,065 to 74,714 |
| Change 24h / 7d | -1.27% / +2.49% | Short-term consolidation |
| Change 14d / 30d | +7.41% / +7.27% | Recovery momentum intact |
| Change 200d / 1y | +20.19% / -23.91% | Recovery leg within a deeper correction |
| Market cap | EUR 1.4713trn | Rank 1; ~58.9% of total crypto cap (1,471.3bn / 2,499.7bn) |
| Volume 24h | EUR 23.34bn | ~1.59% daily turnover of market cap |
| BTC dominance | 58.71% | ETH and alts combined ~41.2% residual share |
| Circulating supply | 20,090,346 BTC | 95.67% of 21m cap mined (20,090,346 / 21,000,000) |
| FDV | EUR 1.4713trn | Equals market cap; no dilution overhang beyond mining emissions |
| ATH | EUR 107,662 (2025-10-06) | Current drawdown -31.98% ((73,230 – 107,662) / 107,662) |
Market Setup
Global risk sentiment is neutral with mixed equity momentum and DACH markets broadly in line with global peers. The euro rates backdrop is mixed: the euro area AAA 10Y yield stands at 3.57% (+3.6bp over 5 days), the 10Y-2Y spread sits at 33.7bp, and the 2Y yield has risen roughly 48bp over the past month, a tightening bias that limits valuation support for long-duration and non-yielding assets. FX is similarly mixed, with EUR/USD at 1.1400 (+0.04% over 5 days) and EUR/CHF posting the strongest 5-day move at +0.43%. In equities, the Nikkei 225 leads 5-day performance at +3.26% while the Hang Seng is weakest at -1.76%, and the Nasdaq Composite leads on a 1-month basis at +3.59%. This backdrop matters for Bitcoin, but it is subordinate to the asset-specific drivers: as reported, Fed Chair Kevin Warsh is expected to hold rates through Q3 2026, leaving little room for the easing that has historically supported risk assets [T2], and elevated US Treasury yields raise the opportunity cost of holding a volatile, non-yielding asset like BTC [T4]. For a EUR-based investor, the current EUR/USD level means EUR-quoted returns carry an additional currency translation layer on top of USD-BTC price action.
Investment Thesis
Bitcoin has transitioned from a halving-cycle-driven speculative asset into an ETF-led, allocatable institutional position. By the end of 2025, 6.7 million BTC sat across ETFs, exchanges and corporate treasuries, a period Glassnode described as Bitcoin’s institutional supply era [T1]. Realized volatility has compressed from 84% to 43%, improving the asset’s portfolio integrability [T1]. Spot ETFs approved in the US in early 2024 created a regulated conduit that turned BTC into an allocable line item for registered investment advisors, private banks and institutions [T1][T5]. Analysis now identifies three primary value drivers: market structure, institutional fund flows and the macro environment, marking a departure from the traditional four-year cycle [T5].
The counterweight is equally clear. Institutionalization did not remove Bitcoin’s high-beta character: in Q4 2025 more than USD 1trn in market value was erased as BTC fell roughly 30% peak to trough below USD 90,000, lagging gold and bonds [T1]. The current setup, EUR 73,230 and 32.0% below the October 2025 ATH, therefore represents a recovery leg within a still-unresolved correction. The thesis is constructive but conditional: it works if ETF flow momentum persists and macro liquidity does not deteriorate further, and it fails if the flow regime breaks as it did in late 2025.
Bullish Drivers
- ETF flow re-acceleration. Bitcoin ETFs recorded USD 1.92bn in weekly inflows in late August 2026, with BlackRock’s IBIT taking a dominant share, and investors positioning ahead of potential upside rather than reacting to it [T7]. Earlier in 2026, USD 467m net inflows on May 5 alone marked a fourth consecutive day of positive flows [T6].
- Broad institutional recognition. 94% of institutional investors reportedly recognize long-term blockchain value, with daily ETF inflows at times consistently exceeding USD 400m [T3].
- Supply scarcity intact. 95.67% of the 21m cap is mined and corporate treasuries increasingly treat BTC as a strategic reserve asset; the halving constraint remains structurally in place [T3][T5].
- Regulatory pipeline. The CLARITY Act would establish a federal market-structure framework and could unlock broader institutional participation if passed [T2]. In Asia, Hong Kong’s Stablecoins Ordinance and RWA tokenization show the regulated infrastructure deepening, though pure BTC ETFs play a smaller strategic role there than in North America and Europe [T2].
- Technical repair. USD 80,000 (roughly EUR 70,175 at EUR/USD 1.1400) has shifted from resistance to support, with the USD 85,000 to 90,000 zone (approx. EUR 74,561 to 78,947) as the next resistance band; the current EUR price sits just below the lower edge of that zone [T6].
Relative Positioning vs Gold and Ethereum
Versus gold, the record is mixed. BTC lagged traditional assets including gold and bonds during the 2025 correction despite its institutionalization [T1], while Ark Invest frames Bitcoin as a long-term share-taker from traditional store-of-value assets like gold [T3]. In a tight-rates regime, gold competes directly for the same inflation-hedge and reserve-asset mandates, and its lower volatility gives it an advantage when institutional risk budgets are constrained. Note that the bundle contains no current gold spot or performance data, so a quantitative gold comparison is unavailable; the positioning here rests on qualitative evidence.
Versus Ethereum, BTC holds the defensive position within crypto. At 58.71% dominance, ETH and all other assets combined account for roughly 41.2% of the EUR 2.50trn total crypto market cap. Record outflows from US-listed BTC and ETH ETFs hit both assets simultaneously in Q4 2025, confirming shared flow sensitivity [T1]. The key differentiation is regulatory: BlackRock’s Robert Mitchnick argues the CLARITY Act matters less for Bitcoin than for altcoins and DeFi, implying BTC’s legal status is comparatively settled [T8]. The practical implication is that BTC should capture the conservative institutional crypto sleeve first, while ETH offers higher beta to both regulatory catalysts and flow reversals. No current ETH price or performance data is available in the bundle, so this comparison is structural rather than quantitative.
Scenario Framework
- Bull case (12-month horizon). ETF inflows sustain at or above recent weekly levels and/or the Fed pivots to easing earlier than expected. BTC reclaims prior-cycle highs consistent with USD 100,000 to 150,000 analyst ranges, equivalent to roughly EUR 87,719 to 131,579 at EUR/USD 1.1400, implying +20% to +80% from EUR 73,230. Anchors: JPMorgan’s flow-based USD 150,000 Q4 2026 target with 72% stated confidence, and Ark’s USD 200,000 2026 milestone (approx. EUR 175,439, +139%), which we treat as an aggressive outer marker, not a base case [T3].
- Base case. The Fed holds through Q3 2026, the CLARITY Act remains pending and flows oscillate between the USD 1.92bn weekly surge and the USD 202m Aug 28 pullback [T7][T8]. BTC grinds higher with elevated volatility, consolidating in the USD 80,000 to 90,000 equivalent band (approx. EUR 70,175 to 78,947) as adoption compounds. Implied range roughly -4% to +8% from current levels before trend resolution.
- Bear case. Yields rise further, the US Treasury buyback program drains liquidity, and ETF outflows recur as in Q4 2025, when record outflows coincided with a ~30% peak-to-trough drawdown and more than USD 1trn erased [T1][T4][T7]. A comparable high-beta drawdown from EUR 73,230 would imply a retest of the EUR 51,000 to 60,000 region, with the ATH-era support structure as the reference. The exact floor is unavailable in the data and should be treated as indicative.
Valuation Discussion
Traditional valuation frameworks apply only partially to Bitcoin, so we anchor on three lenses. First, supply-scarcity: FDV equals market cap at EUR 1.4713trn because total supply (20,090,387) is effectively circulating, and with 95.67% of the cap mined, remaining issuance is marginal. Scarcity is a floor argument, not a price target. Second, flow-based models: JPMorgan’s USD 150,000 target derives from ETF inflow and treasury-demand dynamics rather than halving cycles [T3], but its validity is conditional on flow persistence; the Aug 28 outflow of USD 202m shows how quickly the input variable can turn [T8]. Third, cycle frameworks: if the four-year halving cycle has genuinely weakened as market structure analysis suggests [T5], traditional cycle-top valuation signals become unreliable and demand-flow metrics gain weight in their place.
Valuation optics also improve through the volatility channel: compression from 84% to 43% [T1] mechanically improves risk-adjusted return metrics, which can justify higher institutional target weights independent of any price target. The honest conclusion is that current pricing (EUR 73,230) sits well below all cited institutional anchors (USD 100,000 to 200,000, or approx. EUR 87,719 to 175,439), but those anchors assume flow persistence and macro conditions that are not currently guaranteed. We treat them as scenario anchors, not house forecasts, particularly given the promotional character of some source material [T3].
Risks
- Rates and liquidity. Rising US Treasury yields raise the opportunity cost of a non-yielding asset, making institutional buyers more selective, and weaker ETF flows are reinforced by on-chain spot-flow data [T4]. The Fed’s expected hold through Q3 2026 removes the historical liquidity tailwind [T2].
- Flow reversal. This is the dominant risk vector. The Q4 2025 precedent shows record ETF outflows coinciding with a ~30% drawdown and more than USD 1trn erased [T1]. The Aug 28 outflow of USD 202m ended the inflow streak, and the divergence between fund flows and spot price signals competing market forces [T8].
- Liquidity event compounding. The US Treasury buyback program beginning in September was explicitly flagged as a potential turning point for the inflow run [T7]. If elevated yields and buyback-related liquidity effects hit simultaneously, both macro and flow channels could turn negative together.
- Regulatory uncertainty. The CLARITY Act’s Senate vote is pending and passage is not guaranteed [T2][T8]. BlackRock’s view implies an asymmetry: failure hurts altcoins more than BTC, but it would still remove a widely anticipated catalyst [T8].
- Concentration. IBIT’s dominant share of inflows [T7] means single-vehicle flow shocks could carry outsized price impact.
- Currency risk for EUR investors. With EUR/USD at 1.1400, EUR appreciation against USD translates directly into EUR-quoted BTC underperformance even if USD-BTC is flat. EUR/USD fell 2.12% over the past month (EUR strengthened), which would have worked against EUR-quoted holders.
- Data recency. The latest available ETF flow datapoint is from late August 2026; no current-week flow data is available, and flow-dependent conclusions carry a staleness risk.
Appendix
Methodology and Data Provenance
Market data retrieved 2026-09-28 04:15 UTC via CoinGecko with EUR as quote currency. News retrieved 2026-09-28 04:15 UTC. Market overview data: ECB yield curve as of 2026-09-24, equity indices as of 2026-09-25/28, FX via Frankfurter as of 2026-09-28. Benchmark assets for this report are gold and ethereum. Report profile: crypto_institutional. USD-denominated targets and technical levels were converted at EUR/USD 1.1400 and are approximate; FX movement alters these conversions. Reported BTC dominance (58.71%) differs slightly from market-cap arithmetic (~58.9%); we use the reported figure. Gold and ETH spot data are unavailable in the bundle, so the relative positioning section is qualitative.
Glossary
- ETF: Exchange-traded fund; spot Bitcoin ETFs provide regulated brokerage-channel exposure to BTC.
- BTC dominance: Bitcoin’s share of total crypto market capitalization.
- FDV: Fully diluted valuation; market cap if max supply were in circulation.
- Halving: The quadrennial 50% reduction in new BTC issuance embedded in the protocol.
- CLARITY Act: Proposed US legislation establishing a federal market-structure framework for digital assets.
Sources
- [T1] Crypto Market 2025: Year-End Review & Expert Insights, TradingView: link
- [T2] Q2 2026 Digital Asset Review, CoinDesk Indices: link
- [T3] Bitcoin Price Prediction 2026: Institutional Adoption & ETF, Intellectia: link
- [T4] US Treasury yields surge to new highs as liquidity tightens, CryptoSlate: link
- [T5] Bitcoin Price Faces a Pivotal Shift: New Market Structure, CryptoRank: link
- [T6] Bitcoin Price Analysis May 2026, Intellectia: link
- [T7] Bitcoin ETF Inflows Surge to $1.92 Billion Last Week, Cryptonomist: link
- [T8] Bitcoin ETF Inflow Streak Ends With $202 Million Pullback as Senate Vote Looms, BigGo Finance: link
Disclaimer
This report is AI-generated and is provided for informational purposes only. It does not constitute investment advice, a recommendation, or an offer to buy or sell any financial instrument. Market data and third-party views may be incomplete, delayed or inaccurate, and price targets cited are external scenario anchors rather than forecasts. Readers should conduct their own analysis and consult licensed advisors before making investment decisions.
Important Note / Wichtiger Hinweis:
EN: This report may have been generated using AI. It processes data from publicly available sources. The content is provided for informational purposes only.DE: Dieser Bericht kann mithilfe von KI erstellt worden sein. Dabei werden Daten aus öffentlich zugänglichen Quellen verarbeitet. Die Inhalte dienen ausschließlich Informationszwecken.
* DE: Die ergänzenden Inhalte können KI-generiert sein. EN: The additional content may be AI-generated.