As the dust settles on 2018 in turbulent fashion, Duncan Lamont, Head of Research and Analytics at Schroders, assesses how market valuations look as we head into 2019.
2018 was a rumbustious year for stock markets, with things really coming to the fore in the latter stages. With investors having grown accustomed to an unusual oasis of calm over recent years, volatility was back with a bang.
However, as the dust settles, there is a silver lining for stock market investors. Even before the fourth quarter downturn, markets had been cheapening in valuation terms. Improving fundamentals were behind this shift. Profit growth for 2018 is projected to be a hefty 24% for the US market, although this is partly down to the Trump administration’s tax reductions. UK and emerging markets are also both forecast to deliver double-digit earnings growth, while Europe is around mid-single digit levels. Japan is bringing up the rear with only 3% earnings growth, but it has seen its fair share of weather-related troubles this year.
If share prices end the year where they started, investors would be in a stronger position from a fundamental standpoint. In simple terms, they would now benefit from more earnings for each dollar that they have invested.
However, recent events have meant that share prices haven’t been flat, they’ve fallen sharply. That means that not only are earnings higher, but prices are lower. This double-whammy has pushed popular earnings-based measures of stock market valuations close to their cheapest levels for many years.
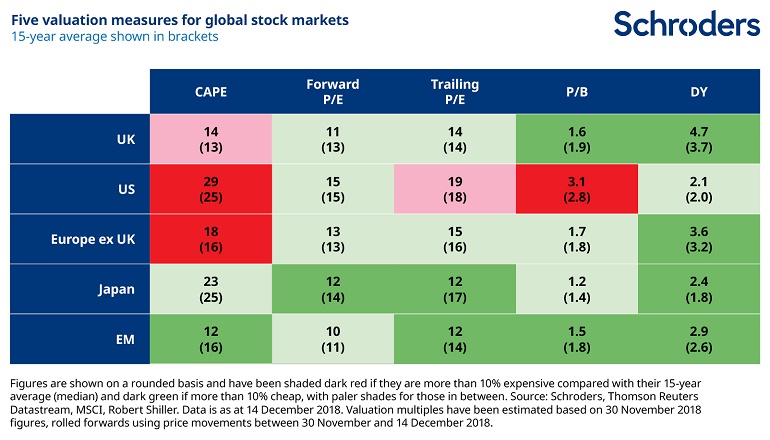
Relative to consensus earnings forecasts for the next 12 months, US, UK, European, Japanese and emerging market equities are valued at close to their cheapest levels for four to six years. There is a similar story when prices are compared to the previous 12 months’ earnings. Japanese equities have not been cheaper on this basis since the depths of the financial crisis.
Other valuation measures have also cheapened – cyclically-adjusted price earnings and price-to-book multiples have fallen and dividends yields risen – but not to the same extent.
The consequence of these moves is that, from a valuation perspective stock markets are now a much more appealing prospect than before. Whereas, as we entered 2018 our valuation table was a sea of (expensive) red, it is now a field of (cheap) green. With the exception of the US, all other markets are now outright cheap on most valuation measures. Even the US is less expensive than it was. (All of the valuations measures are explained below).
While there are undoubtedly short-term challenges facing markets, not least geopolitics, tightening monetary policy and slowing global growth, investing when valuations are cheap is a sound long term strategy. Valuations are the single biggest determinant of long term returns, although their uselessness at predicting short term market movements should always be borne in mind.
Read more: Why 2019 might be a better year for investors
 Past Performance is not a guide to future performance and may not be repeated.
The pros and cons of stock market valuation measures
When considering stock market valuations, there are many different measures that investors can turn to. Each tells a different story. They all have their benefits and shortcomings so a rounded approach which takes into account their often-conflicting messages is the most likely to bear fruit.
Forward P/E
A common valuation measure is the forward price-to-earnings multiple or forward P/E. We divide a stock market’s value or price by the earnings per share of all the companies over the next 12 months. A low number represents better value.
An obvious drawback of this measure is that it is based on forecasts and no one knows what companies will earn in future. Analysts try to estimate this but frequently get it wrong, largely overestimating and making shares seem cheaper than they really are.
Trailing P/E
This is perhaps an even more common measure. It works similarly to forward P/E but takes the past 12 months’ earnings instead. In contrast to the forward P/E this involves no forecasting. However, the past 12 months may also give a misleading picture.
CAPE
The cyclically-adjusted price to earnings multiple is another key indicator followed by market watchers, and increasingly so in recent years. It is commonly known as CAPE for short or the Shiller P/E, in deference to the academic who first popularised it, Professor Robert Shiller.
This attempts to overcome the sensitivity that the trailing P/E has to the last 12 month’s earnings by instead comparing the price with average earnings over the past 10 years, with those profits adjusted for inflation. This smooths out short-term fluctuations in earnings.
When the Shiller P/E is high, subsequent long term returns are typically poor. One drawback is that it is a dreadful predictor of turning points in markets. The US has been expensively valued on this basis for many years but that has not been any hindrance to it becoming ever more expensive.
Price-to-book
The price-to-book multiple compares the price with the book value or net asset value of the stock market. A high value means a company is expensive relative to the value of assets expressed in its accounts. This could be because higher growth is expected in future.
A low value suggests that the market is valuing it at little more (or possibly even less, if the number is below one) than its accounting value. This link with the underlying asset value of the business is one reason why this approach has been popular with investors most focused on valuation, known as value investors.
However, for technology companies or companies in the services sector, which have little in the way of physical assets, it is largely meaningless. Also, differences in accounting standards can lead to significant variations around the world.
Dividend yield
The dividend yield, the income paid to investors as a percentage of the price, has been a useful tool to predict future returns. A low yield has been associated with poorer future returns.
However, while this measure still has some use, it has come unstuck over recent decades.
One reason is that “share buybacks” have become an increasingly popular means for companies to return cash to shareholders, as opposed to paying dividends (buying back shares helps push up the share price).
This trend has been most obvious in the US but has also been seen elsewhere. In addition, it fails to account for the large number of high-growth companies that either pay no dividend or a low dividend, instead preferring to re-invest surplus cash in the business to finance future growth.
A few general rules
Investors should beware the temptation to simply compare a valuation metric for one region with that of another. Differences in accounting standards and the makeup of different stock markets mean that some always trade on more expensive valuations than others.
For example, technology stocks are more expensive than some other sectors because of their relatively high growth prospects. A market with sizeable exposure to the technology sector, such as the US, will therefore trade on a more expensive valuation than somewhere like Europe. When assessing value across markets, we need to set a level playing field to overcome this issue.
One way to do this is to assess if each market is more expensive or cheaper than it has been historically.
We have done this in the table above for the valuation metrics set out above, however this information is not to be relied upon and should not be taken as a recommendation to buy/and or sell If you are unsure as to your investments speak to a financial adviser.
Finally, investors should always be mindful that past performance and historic market patterns are not a reliable guide to the future and that your money is at risk, as is this case with any investment.
This article has first been published on schroders.com.
* DE: Die ergänzenden Inhalte können KI-generiert sein. EN: The additional content may be AI-generated.