
Watch the video
This player shows only the Bitcoin chapter of the daily altii market briefing. Watch the full video on tube.altii.de.
Key Data Snapshot
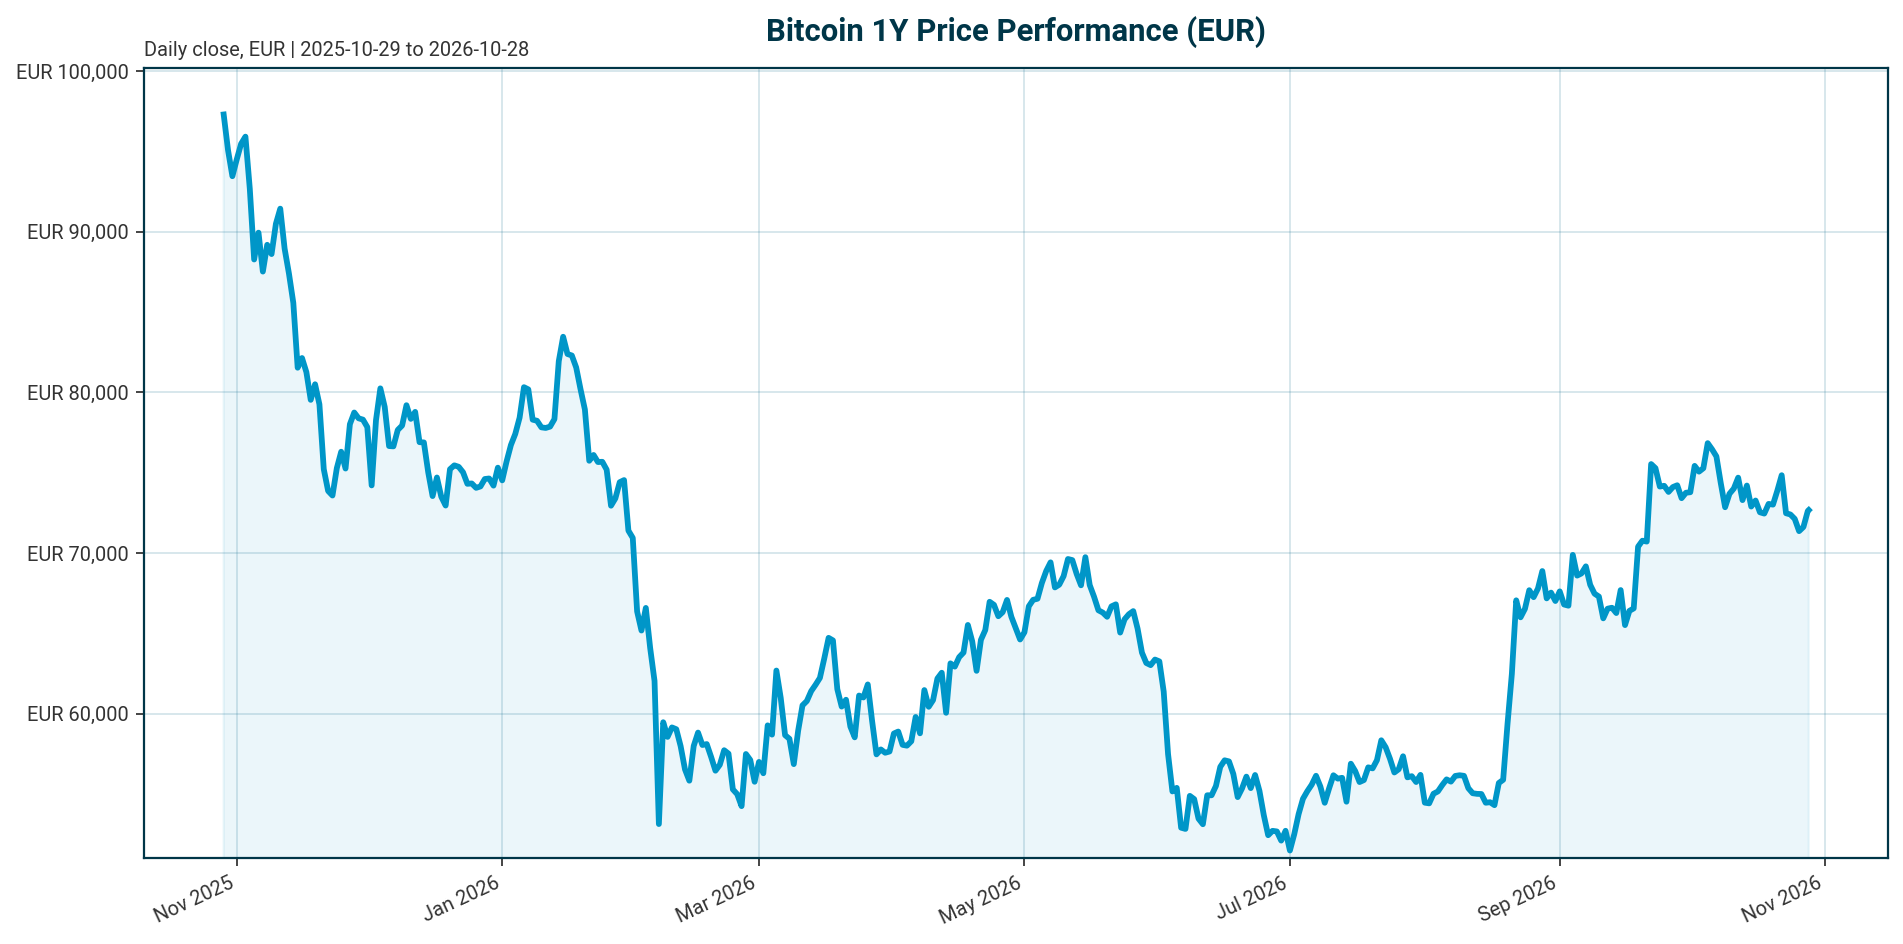
All Bitcoin metrics quoted in EUR, retrieved 2026-10-28T05:15:08Z via CoinGecko.
| Metric | Value | Comment |
|---|---|---|
| Price (EUR) | 72,721 | 24h range 71,414 to 72,981 |
| Change 24h / 7d / 14d / 30d | +1.88% / -2.16% / -3.29% / -2.92% | Short-term momentum negative despite 24h bounce |
| Change 200d / 1y | +11.02% / -28.98% | Medium-term uptrend intact, deep 1y drawdown |
| Market cap | EUR 1.462 trillion | Rank 1; 24h change +1.47% |
| 24h volume | EUR 21.41 billion | ~1.46% of market cap (21.41 / 1,462.02) |
| ATH | EUR 107,662 (2025-10-06) | Current price -32.45% below ATH (72,721 / 107,662 – 1) |
| Circulating supply | 20,104,525 BTC | ~95.73% of the 21,000,000 max supply |
| Fully diluted valuation | EUR 1.462 trillion | Near-identical to market cap, minimal dilution left |
| BTC dominance | 59.41% | Of EUR ~2.456 trillion total crypto market cap |
| Fed funds target range | 3.75% to 4.00% | As of 2026-10-27; last change a 25 bp hike effective 2026-09-17 |
| ECB deposit facility rate | 2.50% | As of 2026-10-28; last change a 25 bp hike effective 2026-09-16 |
| Euro area AAA 10Y yield | 3.37% | -6.7 bp over 5 days, as of 2026-10-26; 10Y-2Y spread 34.8 bp |
| EUR/USD | 1.1175 | -0.38% over 5 days, -4.89% YTD |
Indicative USD conversion: 72,721 x 1.1175 = ~USD 81,266. This reconciles the EUR-quoted price with the USD levels cited in news sources and is a translation, not a market price.
Market Setup
The cross-asset backdrop is neutral to negative on risk sentiment, with moderately negative equity momentum and mixed FX. DACH indicators average -0.29% over 5 days versus +0.26% for global equity indicators, and the Nasdaq Composite is the weakest 5-day performer at -0.84%, a relevant comparison because BTC trades with high beta to US tech and liquidity conditions. The DAX leads on a 1-month basis at +0.72% while the Hang Seng is -6.27% over 1 month, signalling uneven global risk appetite. Euro area yields are mixed with curve flattening: the AAA 10Y sits at 3.37% (-6.7 bp over 5 days, -24.1 bp over 1 month), the 2Y at 3.03%, and the 30Y at 3.60%, with a 10Y-2Y spread of 34.8 bp. EUR/USD trades at 1.1175, -0.38% over 5 days; a softer EUR mildly flatters EUR-quoted BTC returns relative to USD-quoted BTC.
Policy is restrictive. The Federal Funds target range stands at 3.75% to 4.00% after a 25 bp hike effective 2026-09-17, and the ECB deposit facility rate is 2.50% after a 25 bp hike effective 2026-09-16. Both central banks tightened in September 2026, so liquidity remains a headwind for BTC unless data forces a pivot. If euro yields continue their 1-month decline and equity momentum stabilises, the liquidity backdrop turns incrementally supportive of a BTC-EUR recovery. BTC’s own momentum, negative across 7d, 14d and 30d windows, is consistent with this neutral-to-negative risk environment.
Investment Thesis
Bitcoin has become a flow-driven macro asset rather than a narrative-driven one. Its EUR-quoted fair value is set by the tension between expanding institutional distribution channels and restrictive global liquidity [T4]. ETF flows now function as Bitcoin’s marginal price driver: record outflows from US-listed BTC and ETH ETFs in Q4 2025 coincided with breaks of key support around $98,000 and a retest of the low $90,000 range, according to the TradingView year-end review [T2]. By end-2025, 6.7 million BTC sat across ETFs, exchanges and treasuries, which Glassnode described as Bitcoin’s “institutional supply era” [T2].
The structural side of the thesis is intact. Net new mining supply of roughly 160,000 BTC per year is small against ETF holdings above 1 million BTC equivalent, so holder reallocation, not issuance, drives price formation [T4]. Institutional adoption has deepened liquidity and regulated price discovery, but it has also tied BTC more closely to traditional macro and credit cycles than during the retail-driven era [T3]. Volatility has compressed from 84% to 43% per the Glassnode x Fasanara 2025 report [T2], though The Block notes adoption has not eliminated volatility, only changed its drivers [T3].
The two-sided scenario framing follows directly: if inflows broaden across wirehouses and eventually retirement channels, the structural bid can overwhelm modest supply growth [T4]. In a tight-liquidity environment, those same ETFs can become forced sellers, amplifying drawdowns [T4]. With the Fed and ECB both having hiked in September 2026, the near-term flow channel is impaired while the structural channel continues to widen.
Bullish Drivers
- Retirement channel potential. A 1% allocation of the USD 22 trillion US 401(k) and Defined Contribution system would generate USD 90 to 130 billion of steady, rules-based inflows, on par with today’s entire spot BTC ETF market size [T4]. Converted at EUR/USD 1.1175, that is roughly EUR 80.5 to 116.3 billion, comparable in scale to the EUR 57.0 billion of 24h global crypto volume for context.
- Whale accumulation. Wallets holding 1,000 BTC or more accumulated into November’s fear, suggesting a provisional floor under price [T4].
- Regulatory clarity. The US CLARITY Act would establish a federal market-structure framework and potentially unlock broader institutional participation if passed [T1]. A September 15 procedural vote on the Act was identified as a 2026 sentiment swing factor [T6]. Hong Kong’s Stablecoins Ordinance, requiring full reserve backing, redemption rights and risk controls, shows jurisdictions building prudential-compatible frameworks [T1].
- Product infrastructure. Deep, liquid options markets on regulated bitcoin ETFs enable covered call, buffered and other derivatives-based income strategies, widening the institutional product shelf [T1].
- Slow but broadening participation. US pension plans are gradually adding ETF positions, UK and Asian plans are evaluating allocations, and sovereign wealth funds and central banks have appeared in 13F filings with modest positions [T3]. Strong August inflows across major crypto ETF products improved the outlook into September 2026 [T6].
Relative Positioning vs Gold and Ethereum
Current gold and Ethereum price levels are not available in the dataset, so no numeric relative-performance claims can be made. The positioning argument is therefore structural.
Versus gold: Gold competes for the same institutional hard-asset mandate. Higher government bond yields have made institutional buyers more selective because government debt now offers a stronger return profile, per CryptoSlate [T5]. In the current restrictive-rate regime, gold’s insensitivity to flows and its established reserve role are comparative advantages. If liquidity conditions ease, BTC’s higher beta to risk appetite should allow it to outperform gold; until then, gold retains the defensive edge.
Versus Ethereum: With BTC dominance at 59.41% of a EUR ~2.456 trillion crypto market, Bitcoin remains the institutional default allocation vehicle. In Asia, pure bitcoin ETFs play a smaller strategic role than in North America and Europe, where tokenization and stablecoins serve as entry points [T1], which partially dilutes BTC’s global institutional monopoly. Growth in SOL and XRP ETF assets would signal capital moving beyond the two largest assets, and the altcoin ETF pipeline is expanding [T6]. ETH outperformance would require confirmation through those altcoin-ETF flows; absent that, BTC keeps the dominant institutional position.
Scenario Framework
The framework is keyed to three variables: ETF flow direction, the Fed and ECB policy path, and the CLARITY Act outcome. All price zones are illustrative scenario assumptions derived from the current price of EUR 72,721, the -32.45% ATH drawdown, and support and resistance levels cited in sources. They are not forecasts.
- Bull scenario: The CLARITY Act advances toward passage, ETF inflows resume, and either the Fed or ECB signals easing. The structural bid from wealth and retirement channels overwhelms modest supply growth [T4], targeting a retest of the EUR 107,662 ATH region over 6 to 12 months.
- Base scenario: Rates hold at current restrictive levels (Fed 3.75% to 4.00%, ECB 2.50%), ETF flows chop, and the CLARITY Act stalls. BTC-EUR ranges broadly between roughly EUR 65,000 and 85,000 with dominance stable. As a dated market expectation, the Fed under Chair Kevin Warsh was expected to hold rates through Q3 2026 according to the CoinDesk Q2 review from July 2026 [T1]; the subsequent 25 bp hike effective 2026-09-17 shows that expectation was overtaken by events, so the hold assumption should be treated as uncertain in both directions.
- Bear scenario: Liquidity tightens further, ETF redemptions accelerate in repeat episodes of the kind CryptoSlate documented with weekly outflows above USD 700 million [T5], and whales distribute accumulated positions, creating overhang [T4]. BTC-EUR breaks below the EUR 70,000 area and extends the drawdown beyond -40% from ATH. USD levels cited in sources, such as the $70,000 test [T7] and $82,000 resistance [T5], are historical context and not direct EUR targets.
Valuation Discussion
Bitcoin generates no cash flows, so DCF-style models do not apply. Valuation rests on flow and supply dynamics, the reflexivity of the ETF channel, and monetary-premium comparison with gold.
Scarcity anchors: Market cap and fully diluted valuation are both roughly EUR 1.462 trillion because ~95.73% of the 21 million max supply already circulates. Annual issuance of ~160,000 BTC equals ~0.80% dilution per year (160,000 / 20,104,525), small against ETF holdings above 1 million BTC equivalent [T4]. With 6.7 million BTC held across ETFs, exchanges and treasuries [T2], supply concentration in institutional wallets creates two-way flow risk rather than a scarcity premium by itself.
Demand-scale anchor: The USD 90 to 130 billion implied by a 1% DC-system allocation is roughly the size of today’s entire spot BTC ETF market [T4]. If flows of that scale materialise, the demand and supply imbalance implies the marginal price must rise materially to clear the market, all else equal.
Downside mechanics: In tight liquidity, ETF forced selling meets inelastic daily issuance of roughly 450 to 500 BTC. Price must fall until value buyers step in; there is no fundamental floor other than holder conviction. Volatility compression from 84% to 43% [T2] mechanically raises BTC’s risk-adjusted attractiveness for portfolio allocation, which supports incremental institutional demand, though The Block cautions that institutionalisation has changed rather than removed volatility drivers [T3].
Risks
- Restrictive policy and tight liquidity. The Fed at 3.75% to 4.00% and the ECB at 2.50% after September 2026 hikes keep liquidity conditions tight. Higher yields make institutional buyers more selective as government debt offers a stronger return profile [T5].
- ETF forced-selling mechanics. The Q4 2025 pattern of record outflows coinciding with support breaks [T2] could repeat under current rates and deepen the drawdown beyond -32.45% from ATH.
- Issuer concentration. ETF assets are concentrated in a handful of issuers, raising market-structure risk if any issuer experiences operational stress [T3].
- Custody and operational risk. Custody remains a risk even with qualified custodians; hacks and internal exploits could put funds at risk [T3].
- Regulatory risk. Future negative regulatory developments could significantly affect institutional capital allocation [T3]. CLARITY Act failure would significantly reduce the chances of market-structure progress during 2026 [T6].
- Leveraged treasury structures. Digital asset treasury companies using leveraged equity strategies have shown amplified drawdowns relative to the underlying token [T3].
- Correlation risk. BTC is now more tightly linked to traditional macro and credit cycles than in the retail era, reducing its diversification benefit [T3].
- Whale overhang. Accumulated whale positions are a provisional floor but also a future source of supply if macro deteriorates [T4].
An earlier-than-expected policy pivot or CLARITY Act passage would neutralise the two largest identified risks, liquidity and regulatory uncertainty.
Appendix
Data Provenance
- All BTC metrics from the CoinGecko bundle, retrieved 2026-10-28T05:15:08Z, quoted in EUR.
- Macro data as-of dates: DAX, ATX, S&P 500 and Nasdaq as of 2026-10-27; Euro Stoxx 50, Nikkei, Hang Seng and FX as of 2026-10-28; ECB yield curve as of 2026-10-26.
- Policy rates from the authoritative Policy Rates block: US Federal Funds target range 3.75% to 4.00% (as of 2026-10-27, FRED source); ECB deposit facility rate 2.50% (as of 2026-10-28, ECB source).
Source Dating Caveats
- T1 is the CoinDesk Q2 2026 review, published July 2026. Its statement that the Fed was expected to hold rates through Q3 is a dated market expectation, superseded in part by the actual 25 bp hike effective 2026-09-17.
- T6 refers to September 2026 events. T8 is dated 2026-01-16 but its available content is navigation boilerplate and is not used for substantive claims.
- T2, T3, T4, T5 and T7 lack publication dates in the dataset and are cited as undated in dataset. USD price levels cited in them ($98,000, $90,000, $82,000, $70,000) may be stale relative to the current EUR 72,721 price and are presented as historical context only.
- Currency note: BTC is quoted in EUR but the ETF complex and most news flow are USD-denominated. At EUR/USD 1.1175, EUR-quoted performance differs from USD-quoted narratives, and USD levels are context, not direct EUR targets.
- No current ETF flow data, gold price, or Ethereum price is available in the dataset; flow and benchmark claims rely on dated source anecdotes.
Glossary
- BTC dominance: Bitcoin’s share of total crypto market capitalisation, here 59.41%.
- FDV: Fully diluted valuation, price multiplied by maximum supply.
- DAT: Digital asset treasury, a corporate structure holding crypto on balance sheet, often with leveraged equity exposure.
- CLARITY Act: Proposed US legislation establishing a federal market-structure framework for digital assets.
- Stablecoins Ordinance: Hong Kong legislation requiring full reserve backing, redemption rights and risk controls for stablecoins.
- 401(k)/DC channel: The US defined contribution retirement system, roughly USD 22 trillion in assets, a potential source of rules-based ETF inflows.
Sources
- [T1] Q2 2026 Digital Asset Review, CoinDesk Indices: link
- [T2] Crypto Market 2025: Year-End Review & Expert Insights, TradingView News: link
- [T3] Institutional Bitcoin Adoption Explained: How Blackrock, Fidelity and Others Embraced BTC, The Block: link
- [T4] Bitcoin 2026 outlook: ETF gravity vs. Macro ceiling, 21Shares: link
- [T5] US Treasury yields surge to new highs as liquidity tightens, pushing Bitcoin back below $82,000 resistance, CryptoSlate: link
- [T6] Crypto ETFs Enter a New Phase in September: Here’s What Investors Should Watch, Bitcoin Foundation: link
- [T7] Bitcoin Tests $70,000 As Intraday Squeeze Lifts Market, CryptoRank.io: link
- [T8] Kraken sees 2026 crypto markets shifting from hype to structure as macro forces reshape bitcoin cycle, The Block: link
Disclaimer
This report is AI-generated and provided for informational purposes only. It does not constitute investment advice, a recommendation, or an offer to buy or sell any financial instrument. Data may be incomplete, delayed, or inaccurate, and scenario price zones are illustrative assumptions rather than forecasts. Readers should conduct their own research and consult a licensed financial advisor before making investment decisions.
Important Note / Wichtiger Hinweis:
EN: This report may have been generated using AI. It processes data from publicly available sources. The content is provided for informational purposes only.DE: Dieser Bericht kann mithilfe von KI erstellt worden sein. Dabei werden Daten aus öffentlich zugänglichen Quellen verarbeitet. Die Inhalte dienen ausschließlich Informationszwecken.
* DE: Die ergänzenden Inhalte können KI-generiert sein. EN: The additional content may be AI-generated.