
Watch the video
This player shows only the Gold chapter of the daily altii market briefing. Watch the full video on tube.altii.de.
Key Data Snapshot
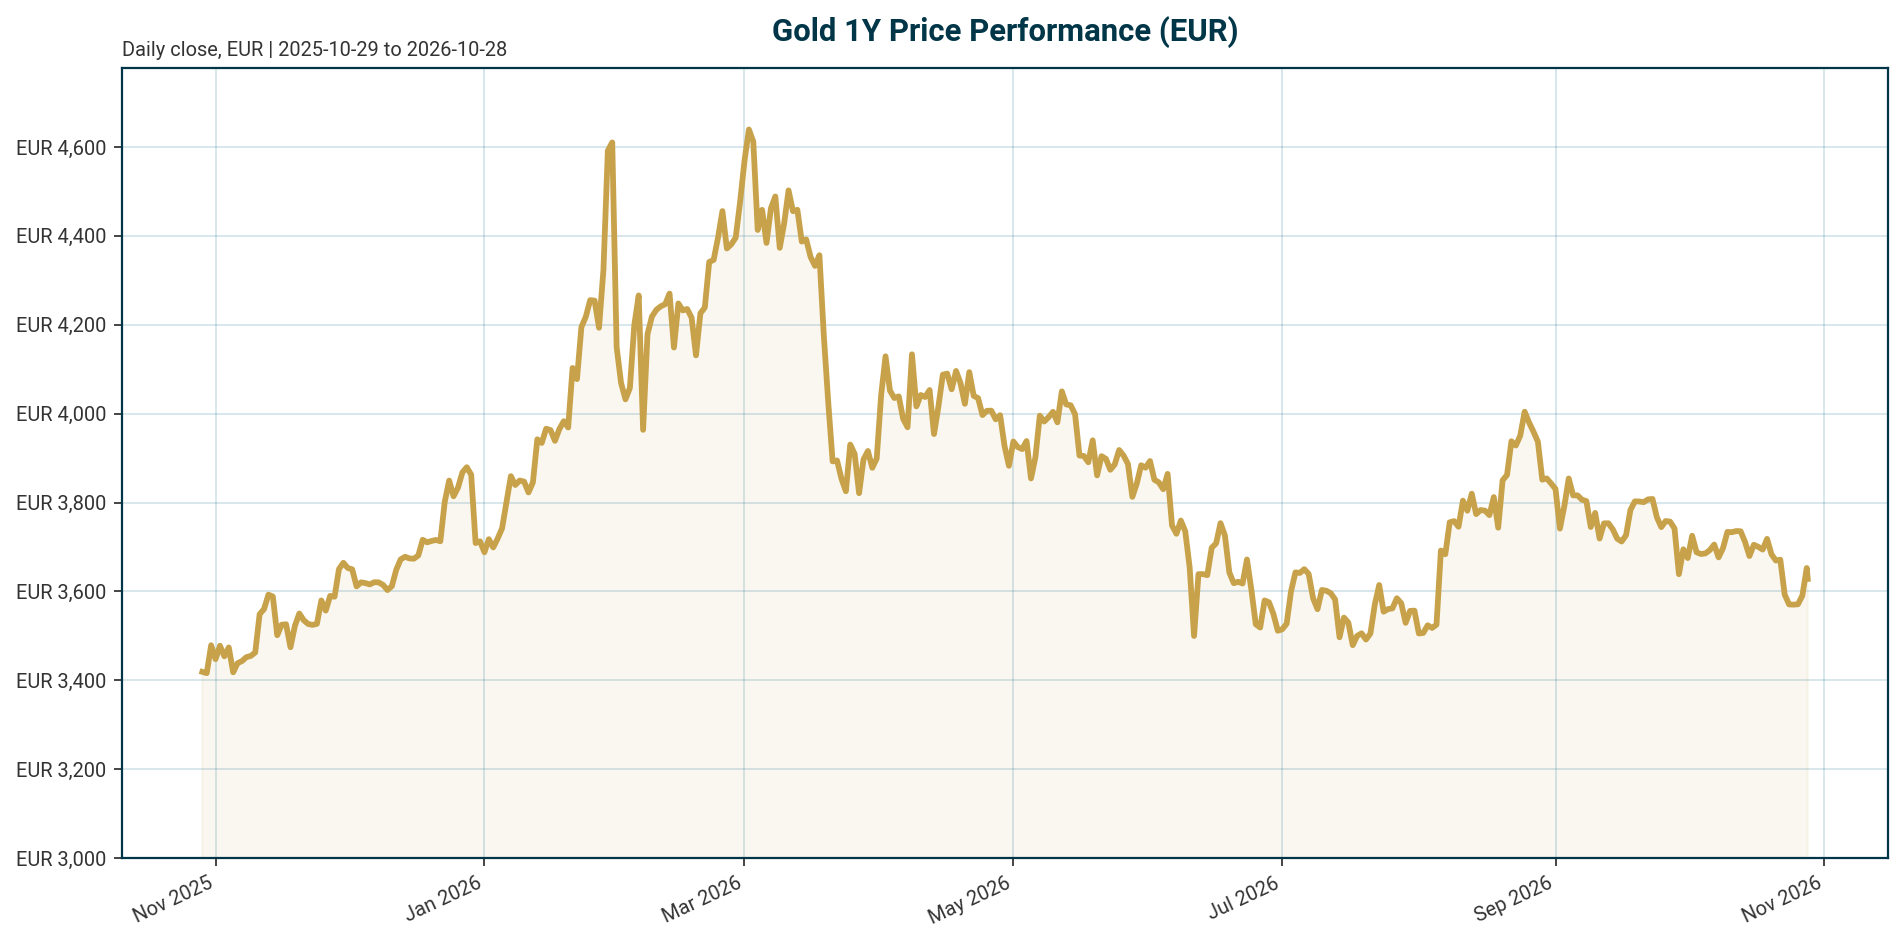
Gold (XAU), quoted in EUR via the PAXG token wrapper, trades at EUR 3,630.16 as of 28 October 2026 (retrieved 05:20 UTC). The metal is up 0.94% over 24 hours but remains in a consolidation regime across longer horizons.
| Metric | Value | Comment |
|---|---|---|
| Price (XAU/EUR) | 3,630.16 | 24h range 3,595.95 to 3,660.09 |
| 24h change | +0.94% | 1h change -0.16% |
| 7d / 14d change | -2.04% / -3.02% | Short-term momentum negative |
| 30d change | -3.91% | Consolidation pace |
| 200d change | -14.67% | Extended drawdown regime |
| 1y change | +1.19% | Roughly flat year-on-year in EUR |
| All-time high | 4,688.32 EUR (28 Jan 2026) | Currently -22.57% below |
| All-time low | 1,265.28 EUR (17 Nov 2019) | +186.91% since |
| Market cap / 24h volume | EUR 1.62 bn / EUR 88.6 m | Turnover ratio ~5.5% of market cap |
| Circulating supply | 446,125.5 oz-equivalents | Tokenized wrapper, not physical stock |
| Fed funds target | 3.75% to 4.00% | Last change: +25 bp hike, effective 2026-09-17 |
| ECB deposit facility rate | 2.50% | Last change: +25 bp hike, effective 2026-09-16 |
| Euro AAA 10Y yield | 3.37% | -6.7 bp over 5 days; 10Y-2Y spread 34.8 bp |
| EUR/USD | 1.1175 | -0.38% over 5 days; -4.89% YTD |
Drawdown calculation: 3,630.16 / 4,688.32 – 1 = -22.57%. Distance above ATL: 3,630.16 / 1,265.28 – 1 = +186.91%. Curve spread: 3.3736% – 3.0254% = 34.8 bp.
Macro Backdrop
The macro tape is neutral to negative on risk, with moderately negative equity momentum and DACH indices broadly in line with global peers. DACH indicators average -0.29% over five days versus +0.26% for global equity benchmarks; the Nikkei 225 leads five-day moves at +1.62% while the Nasdaq Composite lags at -0.84%. The DAX leads on a one-month basis at +0.72%. Rates are mixed with a flattening curve: the euro area AAA 10Y yield sits at 3.37%, down 6.7 bp over five days and 24.1 bp over a month, but up 42.6 bp year-to-date, while the 2Y is up 91.7 bp YTD, compressing the 10Y-2Y spread to 34.8 bp. FX is mixed, with EUR/USD at 1.1175, down 4.89% YTD, a tailwind for EUR-quoted gold returns.
Policy has turned hawkish. The Federal Funds target range stands at 3.75% to 4.00% following a 25 bp hike effective 17 September 2026, and the ECB deposit facility rate is 2.50% following a 25 bp hike effective 16 September 2026. Bundesbank President Nagel defended the ECB’s June and September hikes and stressed data-dependent policy, citing supply-side inflation risks including low energy inventories, damaged refining capacity, droughts and fertilizer shortages [T2]. He also noted oil had risen from roughly USD 70 before the summer break to above USD 100 following the US-Iran conflict, according to conference coverage [T2]; this is a dated news figure, not the current state. The baseline implication: a higher-for-longer real-yield environment caps gold’s near-term upside, while a stagflationary mix of slowing growth and persistent inflation would remain supportive over the longer term [T5].
Investment Thesis
The core thesis is a dual-driver framework: structural official-sector demand provides a price floor, while cyclical real-yield pressure caps the ceiling. Société Générale identifies central bank flows and real yields as the two primary forces shaping gold, with official buying reducing the metal’s sensitivity to short-term rate expectations [T6]. The bank remains “strategically bullish,” arguing a post-2022 regime shift has seen gold trade near record highs despite positive real yields, with central bank purchases, dedollarisation, geopolitical uncertainty and sovereign debt concerns providing a higher floor [T1].
The structural evidence is substantial. Gold’s share of global central bank reserves has risen from roughly 14% in 2023 to nearly 25%, per Bundesbank President Nagel as cited in LBMA conference coverage [T2]. China has increased gold reserves for an 18th consecutive month amid dollar diversification [T3]. A record 43% of 73 global monetary authorities expect their own gold reserves to rise over the next year [T8], and the World Gold Council’s survey shows more central banks poised to add [T4]. The Dutch central bank moved roughly 86 tonnes from the US and Canada to London between March and August 2026 for crisis preparedness, cutting the US share of Dutch gold from 31.3% to 18.5% [T2]. With public debt-to-GDP at or near post-war highs in advanced economies, historical resolutions via financial repression, inflation or currency depreciation all favour gold [T7].
The bear-side counterweight: SocGen flags a sharp monetary policy reversal driving rapidly rising real yields as the key risk [T6], and near-term positioning is not stretched with the market skewed toward consolidation, though analysts remain constructive over 12 months [T4]. For EUR-based investors, the stance is constructive but patient: accumulate on weakness, recognising that the structural floor limits downside while the hawkish policy backdrop limits immediate upside.
Bullish Drivers
- Reserve diversification as a structural backstop. Central bank buying, particularly from emerging economies diversifying away from the US dollar, absorbs supply and provides a consistent price floor [T6]. Gold’s reserve share has climbed from roughly 14% in 2023 to nearly 25% [T2].
- Weakening yield correlation. Gold’s traditional negative correlation with bond yields is systematically weakening; gold held above USD 4,000/oz even as US Treasury yields topped 5%, per LBMA conference coverage [T2]. This is a dated news figure, not current market data.
- Debasement trade rationale. Unsustainable global debt burdens, persistent inflation and concerns over fiat purchasing power are driving higher allocations [T2]. Debt trajectories at post-war highs historically resolve in ways that favour gold [T7].
- Inflation persistence. Supply-side risks and the energy price rise from roughly USD 70 to above USD 100, per Nagel via dated coverage [T2], support the inflation narrative underpinning demand.
- Steady ETF and institutional demand. ETF inflows have moderated but remain positive, and lower volatility is improving gold’s appeal to longer-term reserve managers rather than momentum traders [T1].
- Sanctions and geopolitical hedging. Non-aligned nations are reducing dollar reserve mix to insulate against sanctions risk [T8].
- Dip-buying depth. Deeper pullbacks have repeatedly attracted central bank and longer-term buyer demand rather than collapsing into sustained bear markets [T5][T3].
If the reserve-share trajectory holds, incremental official demand alone could absorb mine and recycled supply during drawdowns. Sustained negative real rates, raised in debt-sustainability debates [T7], would be a powerful additional tailwind.
Relative Positioning vs Bitcoin and Ethereum
A disclosure first: the dataset contains no Bitcoin or Ethereum spot prices, so a direct return comparison over 1y or 30d is not computable. Ethereum is a configured benchmark asset, but no ETH price data is present in the bundle. What the data does show: total crypto market capitalisation stands at USD 2.456 trillion with 24h volume of USD 56.97 bn and Bitcoin dominance at 59.41%. The tokenized gold wrapper, by contrast, carries a market cap of roughly EUR 1.62 bn (rank 53) and 24h volume of EUR 88.6 m, a fraction of crypto market activity that underscores a fundamentally different liquidity and investor profile.
Qualitatively, gold’s profile is reserve-grade: a 1-year EUR return of +1.19% with a 22.6% drawdown from its January peak, and lower volatility improving its appeal to longer-term reserve managers [T1]. In a risk-off tape, with risk sentiment neutral to negative and the Nasdaq the weakest five-day performer at -0.84%, high-beta crypto assets would likely underperform gold in the short run. In a renewed risk-on liquidity rally, crypto benchmarks could outperform gold over a three-to-six-month horizon, consistent with gold’s role as a portfolio diversifier rather than a momentum vehicle.
Scenario Framework
Probabilities below are analyst judgment, not model outputs.
| Scenario | Assumptions | XAU/EUR implication |
|---|---|---|
| A: Hawkish continuation (base case, ~50%) | Extended holds or further tightening at the Fed’s 3.75% to 4.00% range and the ECB’s 2.50% keep real yields elevated. Markets were pricing only modest additional Fed tightening when SocGen published, and even that would not satisfy the Atlanta Fed’s Taylor Rule, suggesting inflation risks remain underpriced [T1]. | Consolidation in a range; central bank buying limits downside while elevated real yields cap upside. |
| B: Stagflationary grind (~30%) | Energy and supply-side shocks sustain inflation while growth slows; the curve stays flat at 34.8 bp with the 2Y up 91.7 bp YTD on inflation risk. | Gold outperforms both bonds and equities in EUR terms over the longer term [T5]. |
| C: Policy pivot (~20%) | A faster-than-expected easing cycle, one of the monitorables flagged in debt-sustainability analysis [T7]. Note: ING’s US economist at one point expected two 25 bp cuts in September and December [T5]; this is a dated market expectation, not a decision, and conflicts with the authoritative record showing a September hike. | Re-energised demand; a retest of the January 2026 ATH region near EUR 4,688 becomes plausible. |
Valuation Discussion
Gold has no cashflows, so no intrinsic-value anchor exists; valuation must be framed through regime models, reserve-flow floors and relative drawdown. The traditional inverse real-yield relationship has broken down over the past two years: real yields rose to post-2008 highs after 2022, yet gold posted +13% in 2023 and reached record highs [T8]. SocGen argues gold is breaking away from historical models that would imply significantly lower prices, with structural factors providing a higher floor [T1].
Under the regime-model view, the current 22.57% discount to the January 2026 ATH of EUR 4,688.32 represents a valuation opportunity rather than bubble deflation, particularly with positioning not stretched [T4] and ETF inflows moderated but positive [T1]. Under the mean-reversion view, if the pre-2022 real-yield model reasserts, fair-value estimates implied by historical relationships would sit materially below spot, implying further downside. For EUR investors specifically, the -4.89% YTD EUR/USD move has flattered EUR-quoted returns relative to USD-quoted gold; a euro rebound would remove part of that cushion. Amundi’s view that a challenging monetary backdrop combined with high public debt and reserve diversification should support demand [T4] tilts the balance toward fairly valued with a positive skew, but not cheap by any traditional metric.
Risks
- Real-yield spike. SocGen’s key caution: a sharp monetary policy reversal driving a rapid rise in real yields is the primary headwind [T6]. A higher-for-longer environment keeps real yields elevated [T5].
- Realised downside sensitivity. Gold suffered its worst quarter in 13 years earlier in 2026 amid rate-hike fears [T4], demonstrating what policy repricing can do.
- Slowing official demand. Central bank buying may slow [T5], and the reserve-share and tonnage figures cited here come from secondary news summaries without primary-source verification.
- Profit-taking vulnerability. Gold was up roughly 6% year-to-date in USD terms per dated ING coverage [T5], leaving the market exposed to bouts of profit-taking; the debasement trade does not imply a one-way rally [T2].
- Currency drag. EUR/USD down 4.89% YTD means continued dollar strength would be a direct drag on EUR-quoted returns.
- Opportunity cost. The euro-area 2Y yield is up 91.7 bp YTD; front-end repricing raises the carry cost of holding non-yielding gold for EUR investors.
- Headline insufficiency. Geopolitical headlines alone are insufficient to lift gold [T5]; direction depends on how events shape inflation expectations and real rates.
Tail risk: a rapid real-yield spike combined with renewed USD strength could push XAU/EUR into a deeper drawdown beyond the current 22.6% from ATH. Mitigant: even in drawdowns, official-sector and longer-term demand has historically attracted flows quickly rather than allowing sustained bear markets [T3].
Appendix
Methodology and Data Provenance
- Market data retrieved 2026-10-28T05:20 UTC via CoinGecko (pax-gold, quote EUR). XAU exposure is via a tokenized wrapper; market cap reflects tokenized circulating supply of 446,125.5 oz-equivalents, not the physical above-ground gold stock, and the price may carry small wrapper-specific premia or discounts.
- Policy rates are stated exclusively from the authoritative Policy Rates block: Fed funds target 3.75% to 4.00% (as of 2026-10-27, FRED) and ECB deposit facility rate 2.50% (as of 2026-10-28, ECB key rate). Conflicting figures in news items, such as expected Fed cuts in [T5], are treated as dated market expectations, not current state.
- Euro yield curve data from the ECB as of 2026-10-26; FX from Frankfurter as of 2026-10-28; equity data from STOXX, Wiener Börse and FMP.
- Most Tavily news items lack reliable publication dates. Figures are attributed with source-level dating where available: SocGen report of September 2026 per [T1], CEOWORLD of June 2026 per [T7], CNBC of July 2026 per [T4]. Undated figures are presented as attributed claims, never as current state.
- Definitions: real yield = nominal yield minus inflation expectations; the opportunity-cost framework follows [T8]; the debasement trade = allocation to scarce or hard assets on fiat-purchasing-power concerns per [T2]. No euro-area HICP print, US CPI or breakeven inflation data is in the bundle; real-yield discussion relies on proxies and clearly labelled assumptions. No US Treasury yield series is in the dataset; references to yields above 5% come from dated conference coverage [T2].
- Scenario probabilities are analyst judgment, not model outputs.
Sources
- [T1] It’s time to get bullish on gold again, says SocGen | Kitco News
- [T2] Gold Holds Above $4,000 Even as US Treasury Yields Top 5% | BigGo Finance
- [T3] China Increases Gold Reserves for 18th Month Amid Dollar Diversification
- [T4] Gold suffers worst quarter in 13 years amid interest rate hike fears | CNBC
- [T5] Geopolitics alone isn’t enough to lift gold | ING THINK
- [T6] Gold’s Dual Drivers: Central Bank Flows and Real Yields, According to Societe Generale | CryptoRank.io
- [T7] Central Banks Now Hold More Gold Than Treasuries | CEOWORLD Magazine
- [T8] Is it a golden era for gold? | J.P. Morgan Private Bank U.S.
Disclaimer
This report is AI-generated and provided for informational purposes only. It does not constitute investment advice, a recommendation, or an offer to buy or sell any financial instrument. Data may be incomplete, delayed or inaccurate, and readers should independently verify all figures before making any investment decision.
Important Note / Wichtiger Hinweis:
EN: This report may have been generated using AI. It processes data from publicly available sources. The content is provided for informational purposes only.DE: Dieser Bericht kann mithilfe von KI erstellt worden sein. Dabei werden Daten aus öffentlich zugänglichen Quellen verarbeitet. Die Inhalte dienen ausschließlich Informationszwecken.
* DE: Die ergänzenden Inhalte können KI-generiert sein. EN: The additional content may be AI-generated.