
Listen to the summary
Key Data Snapshot
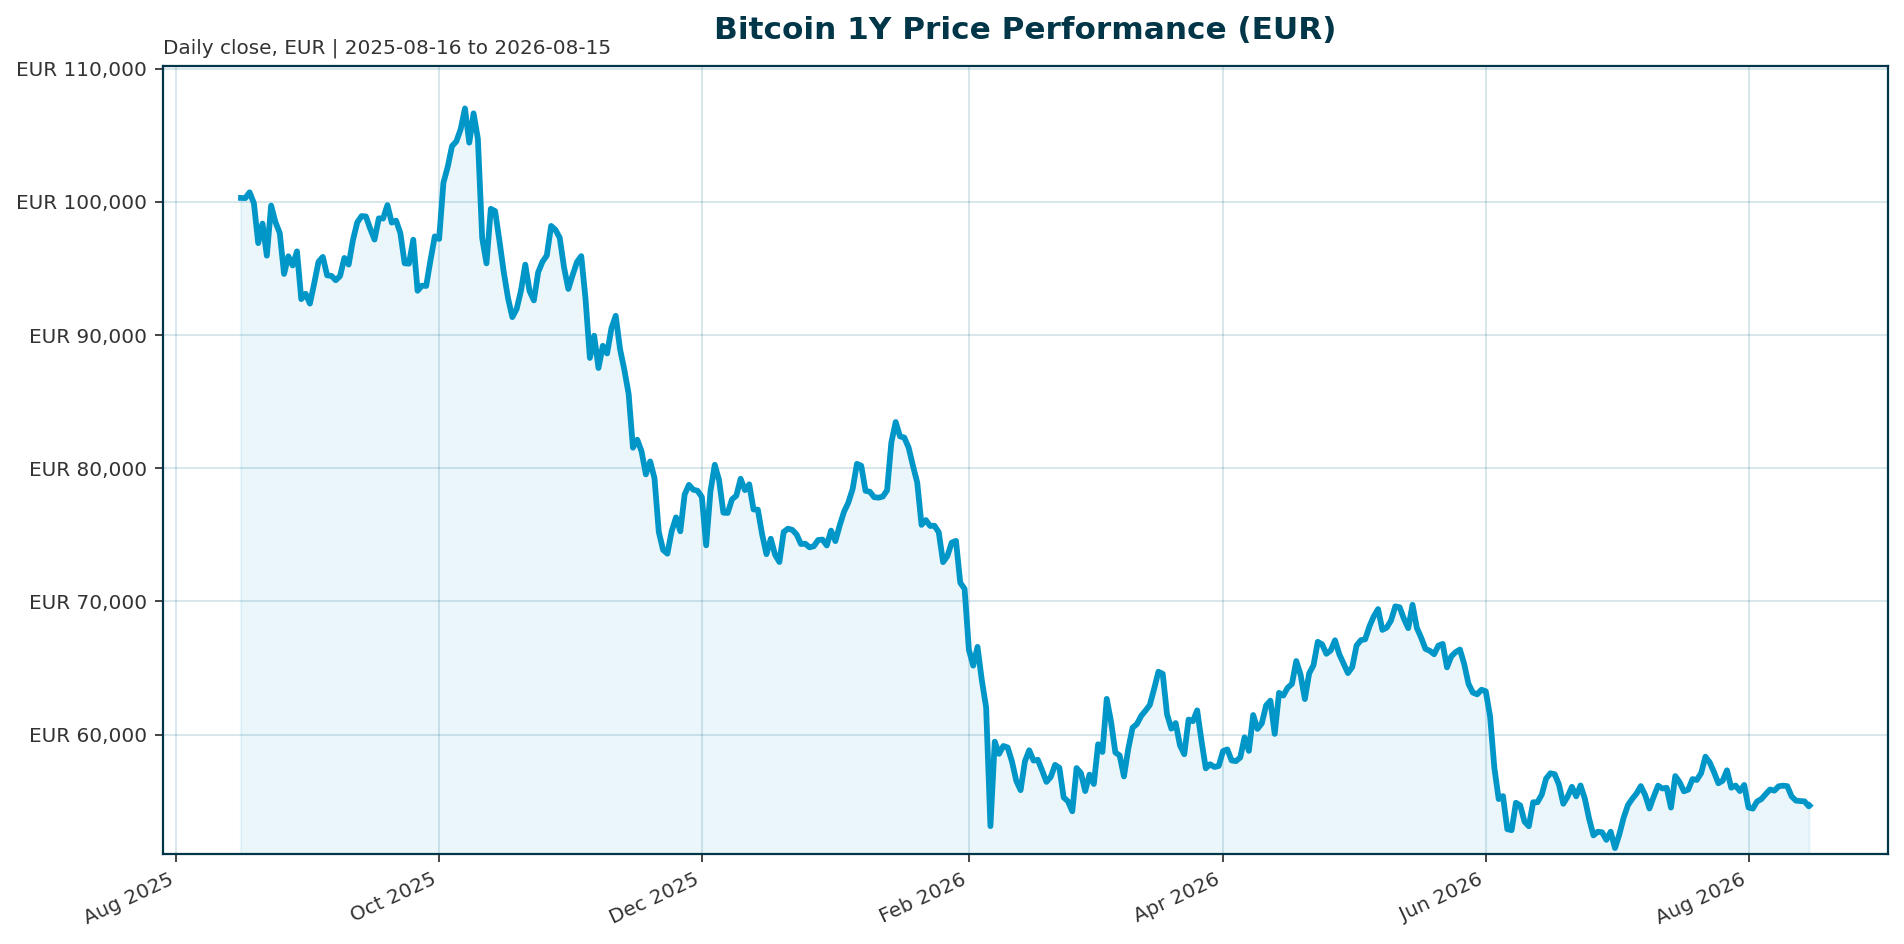
| Metric | Value | Context |
|---|---|---|
| Price (EUR) | 54,470.00 | -0.6% 24h | -2.9% 7d |
| Market Cap | 1.09T EUR | Circulating Supply: 20.07M BTC |
| ATH | 107,662.00 | Oct 2025 | -49.4% discount |
| YTD Change | -47.0% | vs 2025 All-Time High |
| Volatility | 43% | Down from 84% (2025) [T3] |
| ETF Price Discovery | 85% | Primary transmission mechanism [T6] |
Market Setup
The macro backdrop presents a mixed risk profile. Risk sentiment is neutral to positive, supported by strong equity momentum in the DAX (+5.76% 1m) and Nikkei (+4.74% 5d), while the Hang Seng lags (-3.16% 5d). The euro area 10Y yield is 3.16%, indicating mixed rates backdrop, and EUR/USD is flat at 1.1551. Under new Fed Chair Kevin Warsh, the central bank is expected to hold rates through Q3, leaving limited room for policy easing that historically supported risk-asset recoveries [T1].
Investment Thesis
Bitcoin has transitioned into an “institutional supply era” where ETFs dominate price discovery approximately 85% of the time [T6]. This structural shift means institutional demand, which historically exceeded mining supply by 5.6x in 2025 [T6], now drives valuation rather than speculative retail flows. The asset has evolved into a more stable, institutional asset with volatility decreasing from 84% to 43% [T3], yet it remains tightly coupled to macro liquidity conditions and regulatory clarity.
Bullish Drivers
Regulatory progress is a primary catalyst, with the CLARITY Act potentially establishing a federal market-structure framework that unlocks broader institutional participation [T1]. Renewed ETF inflows exceeding daily mining supply (2-3x) would signal a return to the favorable supply-demand dynamics seen in 2025, targeting new all-time highs in the $140,000-$160,000 range by mid-2026 [T6]. Institutional access continues to broaden through regulated investment vehicles and digital asset treasury structures (DATs), making BTC an allocatable line item for traditional financial workflows [T3].
Relative Positioning vs Gold and Ethereum
Currently, Bitcoin underperforms traditional risk assets. While the DAX is up 7.96% YTD and the Nikkei is up 36.50%, Bitcoin is down 47.0% YTD. Gold and Ethereum performance data were unavailable in this report.
Scenario Framework
- Base Case (Hold and Accumulate): The Fed holds rates through Q3. ETF flows stabilize at moderate levels. Bitcoin trades within a range of 50,000 EUR to 80,000 EUR.
- Bull Case (The CLARITY Breakout): The CLARITY Act is passed, and ETF inflows resume at levels exceeding mining supply (2-3x). Bitcoin breaks above 125,000 EUR resistance and extends to new ATHs in the $140,000-$160,000 range by mid-2026 [T6].
- Bear Case (The Macro Squeeze): Rates stay higher for longer. ETF outflows accelerate. Bitcoin tests support levels near 40,000 EUR as liquidity tightens.
Valuation Discussion
Bitcoin trades at a 49.4% discount to its October 2025 ATH of 107,662 EUR. This valuation is supported by structural scarcity (21M max supply) and deep institutional absorption (5.6x demand vs supply) rather than traditional multiples [T6]. The current price reflects a correction phase following the 2025 peak, but the underlying supply-demand imbalance remains favorable for holders.
Risks
- Macro Headwinds: Inflation remains a concern, and the Fed is expected to hold rates through Q3, limiting immediate upside [T1][T2].
- Liquidity Sensitivity: ETF flows can reverse quickly. When liquidity is scarce, flows can reverse, making Bitcoin a high-volatility risk asset [T8].
- Regulatory Uncertainty: Failure of the CLARITY Act or adverse regulatory developments could stall the institutional rotation [T1].
Appendix
Sources
- Q2 2026 Digital Asset Review [T1]
- Bitcoin Holds Near $80K–$81K as ETF Inflows Revive Bullish Sentiment [T2]
- Crypto Market 2025: Year-End Review & Expert Insights [T3]
- Bitcoin (BTC) price touches $70,000 as ETF inflows signal institutional interest [T4]
- BlackRock Bitcoin ETF Achieves Staggering $935M Q1 Inflow Milestone [T5]
- Why Bitcoin ETF Demand Now Trails Daily Mining Supply (Market Impact Explained) [T6]
- Why Bitcoin ETF Demand Now Trails Daily Mining Supply (Market Impact Explained) [T7]
- Bitcoin ETF Flows Lose Momentum After April Surge [T8]
This report is AI-generated for informational purposes only and does not constitute investment advice. The analysis provided is based on data available as of 2026-08-15 and should not be considered as a recommendation to buy or sell any financial instrument.
Important Note / Wichtiger Hinweis:
EN: This report may have been generated using AI. It processes data from publicly available sources. The content is provided for informational purposes only.DE: Dieser Bericht kann mithilfe von KI erstellt worden sein. Dabei werden Daten aus öffentlich zugänglichen Quellen verarbeitet. Die Inhalte dienen ausschließlich Informationszwecken.
* DE: Die ergänzenden Inhalte können KI-generiert sein. EN: The additional content may be AI-generated.