
Watch the video
This player shows only the Bitcoin chapter of the daily altii market briefing. Watch the full video on tube.altii.de.
Key Data Snapshot
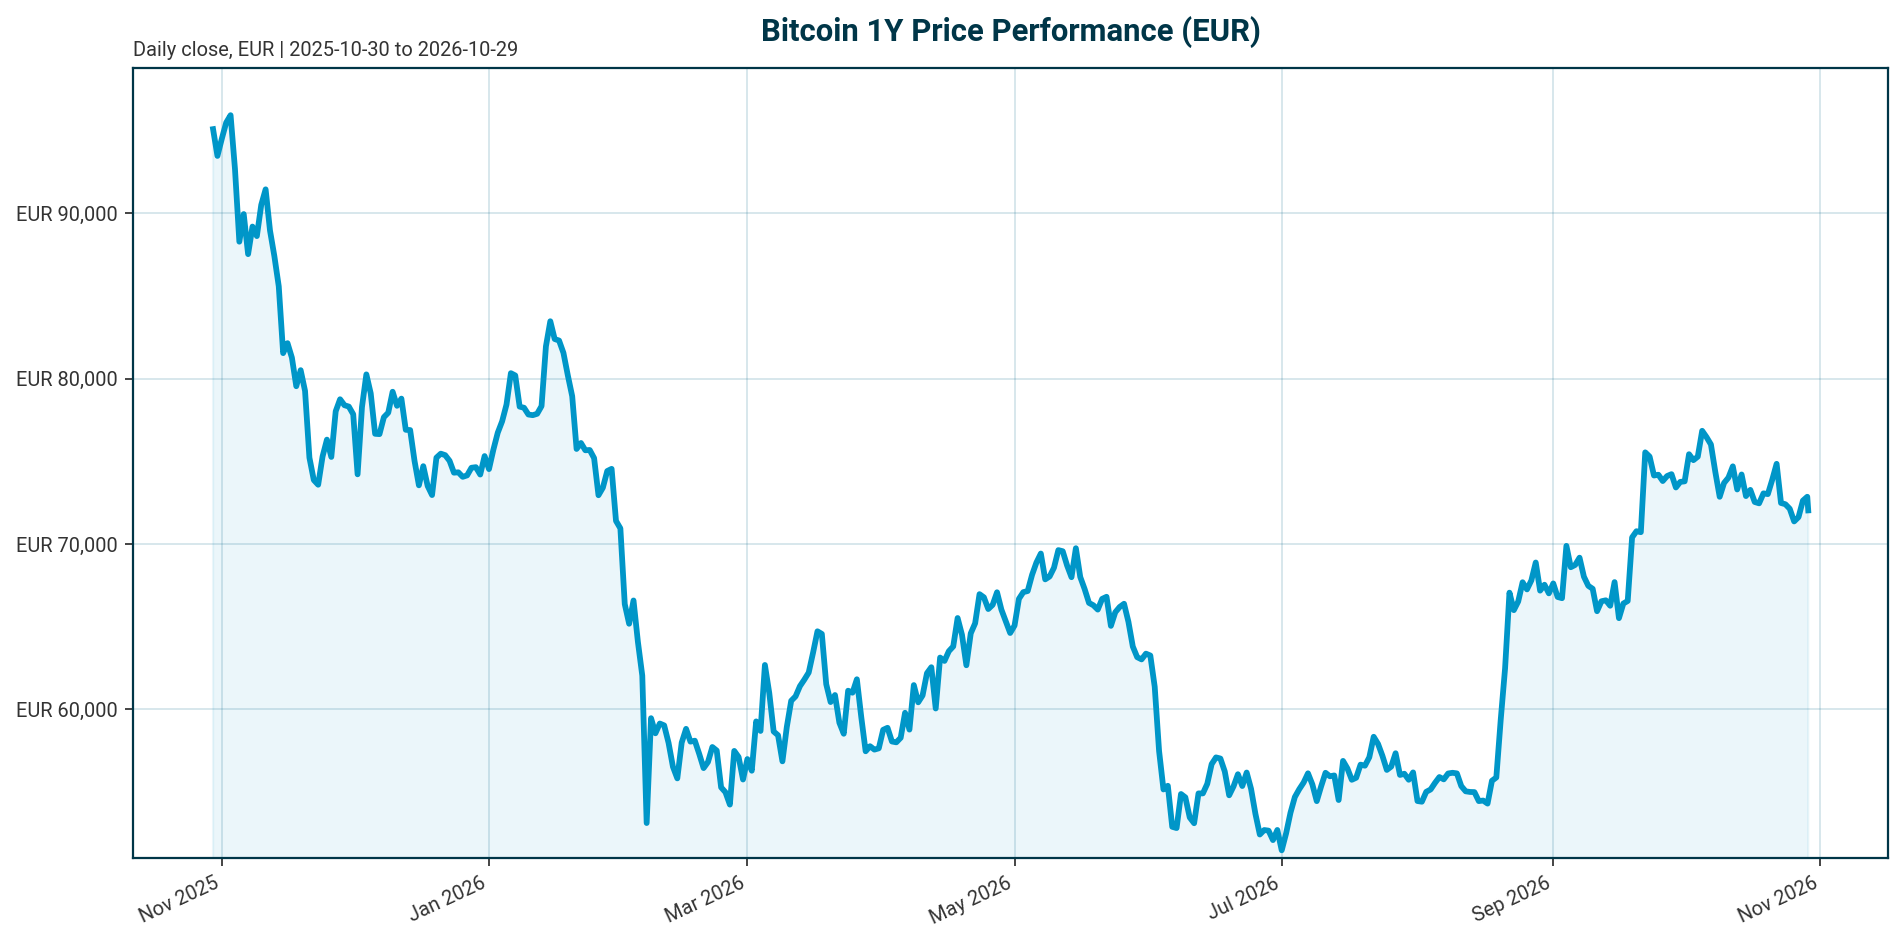
| Metric | Value | Note |
|---|---|---|
| Price (EUR) | EUR 72,097 | 24h range EUR 71,479 to 73,331 |
| 24h / 7d / 30d change | -0.82% / -3.25% / -3.46% | 1h: +0.51% |
| 200d / 1y change | +11.91% / -28.76% | Regime split around the Oct 2025 peak |
| Market cap | EUR 1.449tn | Rank 1; FDV equals market cap |
| 24h volume | EUR 24.32bn | ~1.68% daily turnover of market cap |
| ATH (EUR) | EUR 107,662 (2025-10-06) | Spot is -33.03% below; recovery to ATH implies +49.33% |
| BTC dominance | 59.47% | Total crypto market cap EUR 2.43tn |
| Supply | 20,105,062 of 21,000,000 | 95.74% of max supply issued |
| Fed funds target | 3.75% to 4.00% | As of 2026-10-28; last change: hike of 25 bp, effective 2026-09-17 |
| ECB deposit facility rate | 2.50% | As of 2026-10-29; last change: hike of 25 bp, effective 2026-09-16 |
Market data retrieved 2026-10-29T05:15Z, quoted in EUR. Performance across 7d, 30d and 1y horizons is negative while the 200d return remains positive, marking a mid-cycle consolidation roughly one third below the October 2025 all-time high.
Market Setup
The cross-asset backdrop is neutral in risk sentiment with moderately negative equity momentum, mixed euro rates and mixed FX. DACH indicators average -0.31% over five days versus +1.51% for global equity indicators, so the region is lagging: the ATX is the weakest five-day performer at -1.92% while the Nikkei 225 leads at +2.90%. Euro area AAA 10Y yield stands at 3.37%, down 5.8 bp over five days, with the AAA 10Y-2Y spread at 35.6 bp and the 2Y down 23.6 bp over one month, a modest short-end easing of euro rates. EUR/USD is 1.1156, -0.53% over five days and -5.06% year to date. This backdrop is subordinate to the crypto-specific drivers below, but it frames the EUR-quoted return: a firmer dollar mechanically flatters EUR-quoted BTC when USD-side BTC rallies, and lower euro short rates marginally improve liquidity conditions for EUR-based risk assets.
Policy is restrictive for a zero-yield asset. The Fed funds target range is 3.75% to 4.00% after a 25 bp hike effective 2026-09-17, and the ECB deposit facility rate is 2.50% after a 25 bp hike effective 2026-09-16. Both central banks’ latest moves were hikes, not cuts. No forward rate decisions are in the dataset; any expected moves are not in the dataset and are not stated here. Dated third-party US macro context from Week 40 2026 [T7]: core PCE at 3.2% year over year, Q3 2026 US GDP forecast at +1.8% annualized, and real rates at +0.65%. These are source figures from that week, not current state.
Investment Thesis
Bitcoin is now an institutionalized, supply-capped macro asset, and the EUR-quoted return is driven by three variables: directional ETF demand, the rate cycle, and regulatory clarity. The structural base is intact. US spot Bitcoin ETF AUM exceeds USD 108.82 billion, US ETFs hold roughly 1,313k BTC, and more than 181 listed companies hold BTC on balance sheets, per the institutional radar updated 2026-10-29 [T8]. IBIT alone holds over USD 60 billion in AUM [T8].
However, headline flows overstate directional demand. Approximately 30% to 40% of recorded institutional ETF volume stems from market-neutral cash-and-carry positions rather than directional beta [T4]. Discounting for that, the true directional bid is materially smaller than raw flow figures suggest. On the supply side, 95.74% of the 21 million cap is issued, and long-term holder accumulation stood at 58.2% of supply, up 1.3 points, in Week 40 2026 [T7].
The current setup is a consolidation, not a trend. Spot at EUR 72,097 sits 33.03% below the EUR 107,662 ATH, the 1-year return is -28.76%, and the 200-day return is +11.91%, a dispersion of roughly 40.7 points that marks the regime change around the October 2025 peak. Base case (scenario): BTC consolidates in EUR terms while flows stay positive but mixed, with MVRV at 1.87 [T7] indicating neither a deep discount nor euphoria. Constructive case (scenario): renewed directional ETF demand plus US market-structure progress re-rates BTC toward attributed institutional targets [T1]; this is a scenario, not a forecast.
Bullish Drivers
- Positive weekly ETF flows. Seven-day spot Bitcoin ETF flows of +USD 520 million (Farside Investors, cited in [T7], Week 40 2026), with the weekly signal rated neutral-positive.
- Institutional breadth. The 2026 adoption narrative cites 94% institutional recognition of blockchain value and daily ETF inflows above USD 400 million [T1]; these figures are undated and should be treated as indicative claims, not verified current data.
- Market structure deepening. SEC approval of standardized options on IBIT and peers on Nasdaq and Cboe enables covered-call yield, volatility skew monetization and collar hedges, broadening the institutional toolkit [T4].
- Corporate treasuries. More than 181 listed companies hold BTC [T8], adding a persistent non-ETF demand vector.
- Holders’ conviction. Long-term holder accumulation at 58.2% of supply, up 1.3 points [T7], reduces float available for sale.
- Regulatory catalyst. US market-structure legislation (the CLARITY Act procedural vote referenced for September 15 [T5]) could remove a key institutional approval barrier; the vote is not final passage, so this is a conditional catalyst.
- Supply inelasticity. With 95.74% of max supply issued, a re-acceleration of directional demand would have amplified price impact; the magnitude is a scenario assumption, not a forecast.
Relative Positioning vs Gold and Ethereum
No current EUR price or performance data for gold or Ethereum is present in the dataset, so live comparative returns are unavailable; the positioning argument below rests on structural and flow-based evidence.
Versus gold. Bitcoin competes for the same store-of-value allocation. Ark Invest frames BTC as capturing market share from traditional store-of-value assets like gold, with a USD 1,000,000 projection by 2030 and a 2026 milestone of USD 200,000 [T1]; this is a house view, not a forecast to adopt. In the current regime of neutral risk sentiment and DACH equity lagging, gold would typically outperform BTC; in a flow-on regime, BTC’s supply inelasticity dominates. Which regime prevails is the allocation question.
Versus Ethereum. Bitcoin holds a regulatory asymmetry: it remains an undisputed non-security commodity under existing SEC and CFTC jurisprudence, while second-generation tokens including ETH face distinct scrutiny on staking mechanisms and Howey classification [T4]. Spot Ethereum ETFs were enabled by the Grayscale ruling precedent [T4], but the classification risk is asymmetric against ETH. BTC dominance at 59.47% in the bundle, and steady at 58.3% to 58.9% during Week 40 [T7], confirms BTC is retaining share within crypto amid altcoin turbulence. Scenario (assumption): if SOL and XRP ETF growth broadens capital beyond the two largest assets [T5], rotation could pressure dominance below the 58% to 59% range.
Structural caveat. Custodial concentration applies to the BTC ETF complex itself: Coinbase Custody serves roughly 80% of spot Bitcoin ETF assets [T4], a differentiating single point of failure versus direct gold custody.
Scenario Framework
Probabilities are qualitative labels; no probability data exists in the dataset. Anchors: spot EUR 72,097, ATH EUR 107,662, 24h range EUR 71,479 to 73,331.
- Bear (assumption). Continued ETF outflow swings, which can flip from heavy buying to heavy selling within weeks [T3], combined with restrictive real rates of +0.65% [T7, dated] and decelerating US growth, extend the drawdown beyond the current -33.03% from ATH. No numeric floor is derivable from the dataset.
- Base (assumption). Consolidation in the EUR 70,000 to 80,000 area with neutral sentiment (Fear & Greed at 51 [T8]) and dominance holding near 59%. This is consistent with the Week 40 “bullish consolidation” framing at USD 83k to 86.6k [T7]; those USD price levels are dated Week 40 context, not current state, and sit above the bundle’s EUR 72,097 spot.
- Bull (assumption). Directional ETF demand re-accelerates and US market-structure legislation advances, moving BTC toward attributed institutional targets: JPMorgan’s flow-based USD 150,000 peak target for Q4 2026 with a stated 72% confidence, and Ark’s USD 200,000 2026 milestone [T1]. These are house views. Converted at the bundle’s EUR/USD of 1.1156, USD 150,000 implies roughly EUR 134,460 and USD 200,000 implies roughly EUR 179,300; a +/-5% EUR/USD move shifts these EUR outcomes proportionally. FX path is an explicit assumption on top of model risk.
Triggers to monitor: weekly ETF flow sign and size, the CLARITY Act legislative path [T5], MVRV direction from 1.87 [T7], and any change in central bank policy stance from the current levels — the Fed funds target range of 3.75% to 4.00% (as of 2026-10-28) and the ECB deposit facility rate of 2.50% (as of 2026-10-29).
Valuation Discussion
On-chain valuation is mid-range. MVRV at 1.87 (Glassnode via [T7], Week 40 2026) sits in a historically neutral zone, neither the deep discounts of cycle troughs nor the euphoria of cycle peaks. Scenario (assumption): mean reversion toward trough levels implies EUR downside beyond the current -33% ATH drawdown; re-rating toward peak levels aligns with the USD 100,000 to 150,000 band cited in [T1]. Both are scenarios, not forecasts.
Scarcity metrics are static and supportive but not timing signals. With 20,105,062 of 21,000,000 BTC issued (95.74%) and FDV equal to market cap at EUR 1.449tn, the supply overhang is minimal. US spot ETFs hold roughly 1,313k BTC [T8], about 6.5% of circulating supply (1,313,000 / 20,105,062), and ETF AUM of USD 108.82bn converts to roughly EUR 97.6bn at 1.1156, about 6.7% of BTC market cap.
Flow-based valuation has a known distortion. JPMorgan’s USD 150,000 target rests on a flow-based model [T1], but 30% to 40% of recorded institutional volume is market-neutral cash-and-carry [T4], so flow-derived valuation signals overstate directional demand. The halving-cycle-plus-institutional-demand framing in [T1], which justifies a higher equilibrium multiple than prior cycles, is a contested assumption and should be flagged as such. Finally, real rates at +0.65% [T7, dated] are a valuation headwind for a zero-coupon scarce asset, and the current policy settings (Fed funds target range 3.75% to 4.00%, ECB deposit facility rate 2.50%) keep the carry disadvantage in place.
Risks
- Rates risk. The Fed’s last move was a 25 bp hike effective 2026-09-17 (target 3.75% to 4.00%) and the ECB’s a 25 bp hike effective 2026-09-16 (deposit facility rate 2.50%). Restrictive policy plus real rates of +0.65% [T7, dated] penalizes zero-yield assets. Any expected future moves are not in the dataset.
- Flow reversal risk. ETF flows can swing from heavy buying to heavy selling within weeks [T3]. Dated figures: per [T3], US spot ETFs recorded roughly USD 134.4 million of net inflows over the first two October trading days, after a USD 148.7 million outflow on September 30, and a net outflow of about USD 89.9 million in the latest reported October 5 session. These are source-dated figures, not current flows.
- Custody concentration. Coinbase Custody holds roughly 80% of spot Bitcoin ETF assets [T4]. A custody incident there would be a systemic event for the ETF complex; probability is not derivable from the dataset.
- Regulatory binary risk. Failure of US market-structure legislation would significantly reduce 2026 progress chances [T5]. MiCA compliance shapes and costs the European market structure [T2].
- Macro risk. US growth is decelerating (Q3 2026 GDP forecast +1.8% annualized versus a 2.5% pre-pandemic trend) with core PCE at 3.2% year over year [T7, dated Week 40 2026].
- FX translation risk. EUR/USD at 1.1156, -5.06% YTD, means EUR-quoted BTC returns embed USD translation effects that can mask or amplify USD-side moves.
- Data-quality risk. Several sources (T1, T4, T5, T6) lack publication dates. T1’s claims of 94% institutional recognition and USD 400 million daily inflows are undated and potentially stale or promotional; use with heavy attribution. T7’s USD price levels conflict with the bundle’s EUR spot and are treated as dated context only.
Appendix
Methodology and Data Provenance
Market data: CoinGecko EUR quote, retrieved 2026-10-29T05:15Z. Market overview: equity, rates and FX data as of 2026-10-28/29; euro yields from the ECB yield curve; FX from Frankfurter. Policy rates: FRED (Fed) and ECB key rate, per the authoritative Policy Rates block. FX methodology: USD-denominated targets from [T1] are converted at the bundle’s EUR/USD of 1.1156 as of 2026-10-29; a +/-5% EUR/USD move shifts EUR-converted targets proportionally. Key calculations: supply issued 20,105,062 / 21,000,000 = 95.74%; turnover EUR 24.32bn / EUR 1.449tn = 1.68%; drawdown (72,097 – 107,662) / 107,662 = -33.03%; recovery to ATH 107,662 / 72,097 – 1 = +49.33%; ETF-held supply share 1,313,000 / 20,105,062 = 6.5%.
Source Dating
Dated sources: T2 (updated Oct 21, 2026), T7 (Week 40, 2026), T8 (updated Oct 29, 2026), T3 (references early-October sessions, year dating ambiguous). Undated sources: T1, T4, T5, T6; figures from these are used with explicit attribution and caution.
Glossary
MVRV: market value to realized value, an on-chain valuation ratio. Cash-and-carry: a market-neutral trade long spot ETF shares and short CME futures to capture basis yield. FDV: fully diluted valuation, price times max supply. BTC dominance: BTC market cap as a share of total crypto market cap. CLARITY Act: proposed US market-structure legislation for digital assets. MiCA: the EU’s Markets in Crypto-Assets framework.
Sources
- [T1] Bitcoin Price Prediction 2026: Institutional Adoption & ETF Impact Analysis
- [T2] Bitcoin ETFs in 2026: Institutional Market Structure Shift | InnotechInsider
- [T3] Bitcoin ETF Inflows: How Institutional Money Affects BTC Price
- [T4] Institutional Bitcoin ETFs: Adoption, Trends & Impact
- [T5] Crypto ETFs Enter a New Phase in September: Here’s What Investors Should Watch – Bitcoin Foundation
- [T6] Bitcoin ETF Inflows Hit USD 3 Billion: How Institutional Investment Is Reshaping Crypto Markets
- [T7] BTCMACRO – Bitcoin macro analysis
- [T8] Radar de Smart Money Bitcoin: Fluxos de ETF e Baleias | Anny
Disclaimer
This report is AI-generated, for informational purposes only, and not investment advice. Scenarios are assumptions, not forecasts. House price targets cited from third-party sources are attributed views, not altii recommendations. Data may be delayed or incomplete; verify all figures independently before making allocation decisions.
Important Note / Wichtiger Hinweis:
EN: This report may have been generated using AI. It processes data from publicly available sources. The content is provided for informational purposes only.DE: Dieser Bericht kann mithilfe von KI erstellt worden sein. Dabei werden Daten aus öffentlich zugänglichen Quellen verarbeitet. Die Inhalte dienen ausschließlich Informationszwecken.
* DE: Die ergänzenden Inhalte können KI-generiert sein. EN: The additional content may be AI-generated.