
Watch the video
This player shows only the Gold chapter of the daily altii market briefing. Watch the full video on tube.altii.de.
Key Data Snapshot
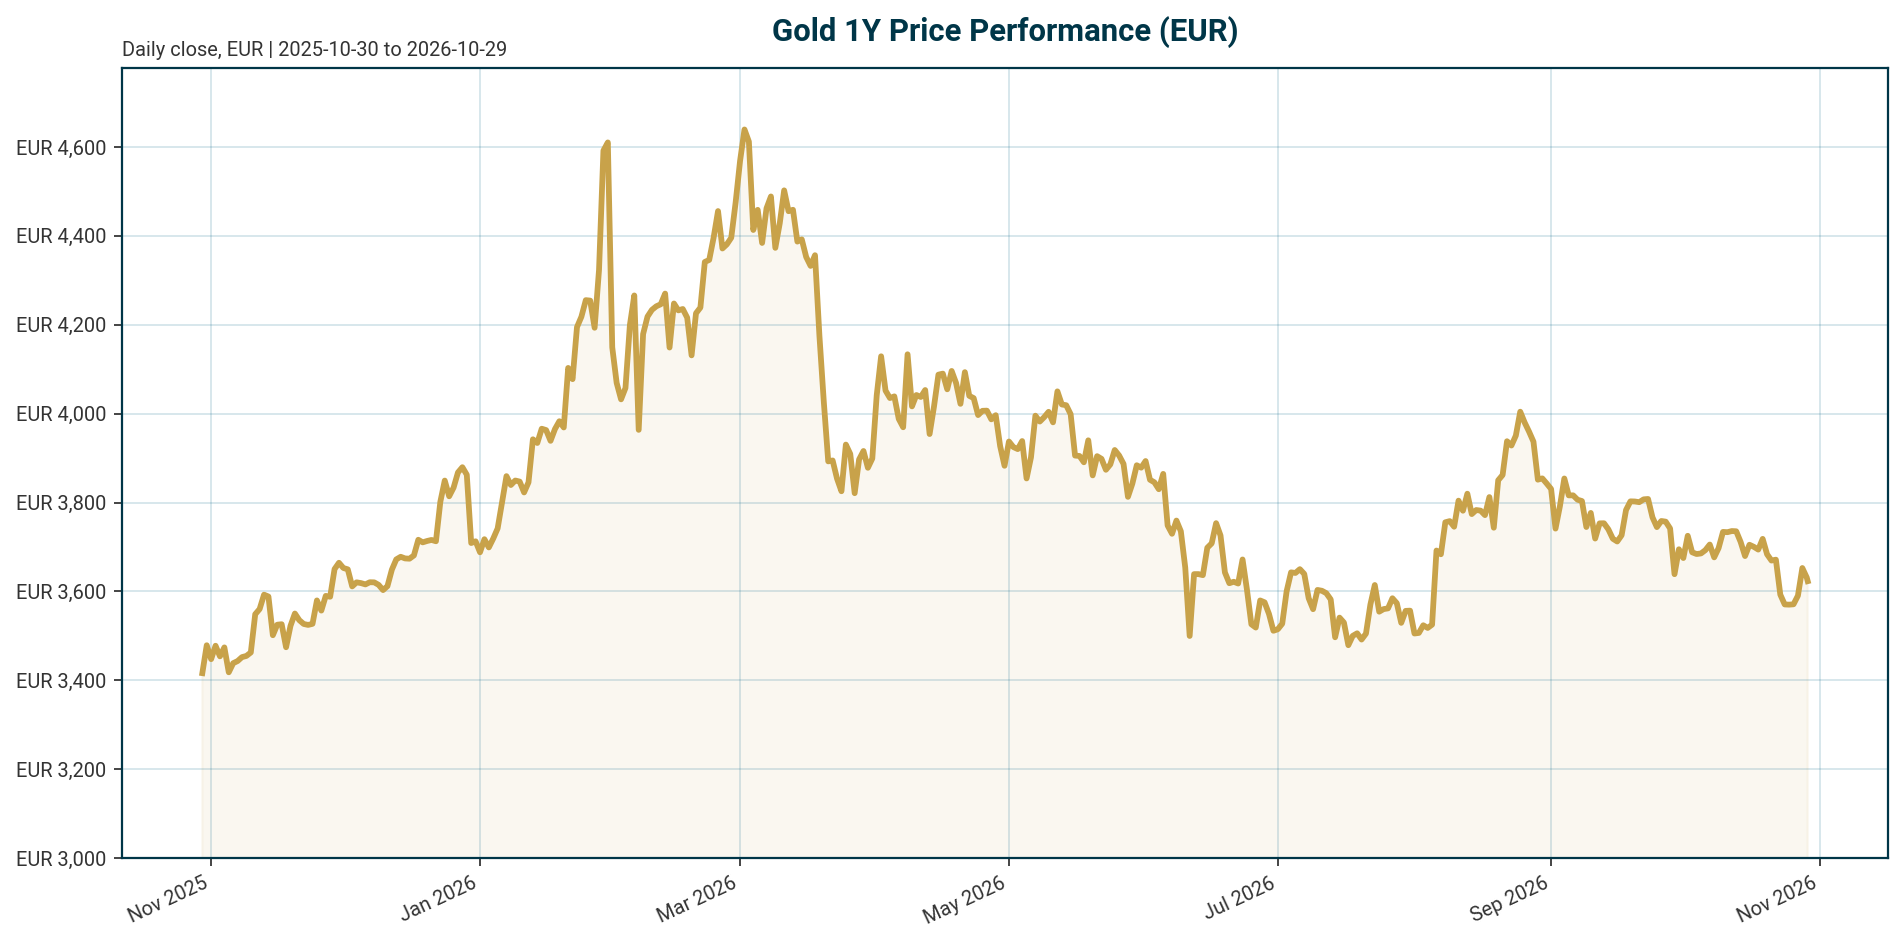
| Metric | Value | As of / Note |
|---|---|---|
| XAU price (EUR) | EUR 3,628.20 | Retrieved 2026-10-29 05:21 UTC |
| 24h range | EUR 3,616.80 to 3,658.49 | Change 24h: -0.06% |
| 7d / 14d / 30d | -1.47% / -2.64% / -2.58% | Corrective tape |
| 200d / 1y | -14.48% / +1.72% | Correction concentrated in recent months |
| All-time high | EUR 4,688.32 (2026-01-28) | Current discount: -22.61% |
| All-time low | EUR 1,265.28 (2019-11-17) | +186.75% above |
| Market cap / 24h volume | EUR 1.618bn / EUR 86.72m | Tokenized proxy (PAX Gold), see Appendix |
| Fed funds target range | 3.75% to 4.00% | Last change: +25 bp hike, effective 2026-09-17 |
| ECB deposit facility rate | 2.50% | Last change: +25 bp hike, effective 2026-09-16 |
| Euro area AAA 10Y yield | 3.37% | -5.8 bp over 5d, -24.4 bp over 1m, +42.3 bp YTD (2026-10-27) |
| Euro area AAA 2Y / 5Y / 30Y | 3.02% / 3.11% / 3.60% | 2Y +90.7 bp YTD (2026-10-27) |
| EUR/USD | 1.1156 | -0.53% over 5d, -5.06% YTD (2026-10-29) |
| EUR/CHF / EUR/JPY / EUR/GBP | 0.9249 / 176.16 / 0.8380 | 2026-10-29 |
Key calculations: drawdown from ATH = (3,628.20 / 4,688.32) – 1 = -22.61%. Recovery to ATH requires (4,688.32 / 3,628.20) – 1 = +29.22%. Policy differential: Fed upper bound 4.00% minus ECB 2.50% = 150 bp, a carry gap relevant to EUR/USD and thus to the currency channel for EUR-quoted gold.
Macro Backdrop
Market overview: Risk sentiment is neutral with moderately negative equity momentum. DACH indicators average -0.31% over five days versus +1.51% for global peers, so the region is lagging; the ATX is the weakest five-day performer at -1.92% while the Nikkei 225 leads at +2.90%. The rates backdrop shows mixed euro yields: the euro area AAA 10Y sits at 3.37%, down 5.8 bp over five days, with a 10Y-2Y spread of 35.6 bp. FX is mixed, with EUR/USD at 1.1156, down 0.53% over five days. These observations are subordinate to the gold-specific analysis below but frame the tape XAU-EUR is trading against.
Policy: The tightening signal is intact. The Federal Reserve funds target range stands at 3.75% to 4.00% after a 25 bp hike effective 2026-09-17, and the ECB deposit facility rate is 2.50% after a 25 bp hike effective 2026-09-16. Both central banks moved in the same direction within two days in September 2026, which raises the nominal yield floor and the opportunity cost of holding a non-yielding asset [T7]. Bank of England and Bank of Japan policy rates are not in the dataset and are therefore not stated here.
Transmission to XAU-EUR: Three channels matter. First, real yields: gold pays no coupon, so higher real yields raise its carry disadvantage [T7]. The dataset lacks current CPI or HICP prints, so realized real yields cannot be computed; we discuss the channel via nominal euro-area yields only. Second, currency: EUR/USD at 1.1156 is down 5.06% YTD, which mechanically supports EUR-quoted gold relative to USD gold. Third, official-sector demand: central bank accumulation provides a structural floor that dampens gold’s sensitivity to short-term rate expectations [T1]. A Crux Investor framework (undated source) describes a four-stage channel in which conflict lifts oil, oil drives inflation persistence, persistence forces tightening, and tightening raises gold’s opportunity cost; in that framework the tightening signal currently dominates [T6].
Investment Thesis
XAU-EUR is in a consolidation phase within a structurally elevated range, not a collapse. The metal trades 22.61% below its January 2026 high of EUR 4,688.32 but remains 186.75% above its 2019 low, with a one-year return of +1.72%. The core thesis follows the Societe Generale dual-driver framework: central bank flows and real yields are the two primary forces, and they currently pull in opposite directions [T1].
On the structural side, the World Gold Council’s 2026 Central Bank Gold Reserves Survey shows central banks accumulated an average of 1,000t of gold over the past four years, double the 500t average of the preceding decade, with record survey participation of 76 institutions [T2] [T4]. Sentiment is firmly positive: 89% of respondents expect global official gold reserves to rise over the next 12 months, and a record 45% expect their own reserves to increase [T4]. On the cyclical side, the September 2026 hikes by the Fed and ECB keep nominal yields elevated, capping upside while official buying limits downside. The result is a range-bound, floor-and-ceiling regime in which XAU-EUR functions as a diversification and crisis-hedge allocation rather than a momentum trade.
Balance: the bear reading is that survey sentiment is intention, not committed flow, and that the tightening cycle has already produced a 14.48% drawdown over 200 days. The bull reading is that the same drawdown occurred against record official demand, which argues the floor is real.
Bullish Drivers
- Structural official-sector bid: Central bank purchases act as a backstop that absorbs supply and reduces gold’s sensitivity to short-term rate expectations [T1]. The 1,000t four-year average versus 500t in the prior decade is a doubling of structural demand [T2] [T4]. Historical context: 2023 purchases of 1,037t and the 2022 record of 1,082t [T5].
- Reserve diversification away from the USD: Emerging market central banks have been diversifying reserves away from the dollar since 2022, a trend Societe Generale describes as showing no signs of abating [T1] [T7].
- Geopolitical hedging demand: 90% of 2026 survey respondents cited gold’s crisis performance as highly relevant; the survey window (Feb 5 to May 19, 2026) followed the outbreak of active military activity in the Middle East. EMDE institutions prioritize geopolitical instability as an allocation driver at 95% versus 67% in advanced economies [T2]. OMFIF and Citi argue gold’s intrinsic, non-sovereign nature enhances its role as a hedge against volatility and offshore-asset seizure risk (September 2025) [T3].
- Forward official intent: 89% of surveyed central banks expect global reserves to rise over the next 12 months; 45% expect their own to increase [T4].
- House view support: UBS (undated source) attributes current pressure mainly to rapidly rising real yields but expects a higher gold price in the medium term [T8].
- Yield relief at the margin: Euro area AAA 10Y yields fell 24.4 bp over the past month, a modest cyclical tailwind for the EUR-quoted real yield proxy.
Relative Positioning vs Bitcoin and Ethereum
The bundle does not include Bitcoin or Ethereum price or return data beyond aggregates, so a quantitative comparison is unavailable; the comparison below is qualitative and uses only the available data.
Gold’s role differs fundamentally from the crypto benchmarks. It is the only asset in this comparison with an official-sector bid: central banks averaging 1,000t of annual accumulation and 89% survey expectations of further reserve growth [T2] [T4]. No comparable sovereign demand exists for Bitcoin or Ethereum. Gold’s crisis-hedge credentials, cited by 90% of surveyed reserve managers [T2], are the key differentiator in reserve allocations.
From the bundle aggregates: BTC dominance stands at 59.45% and total crypto market capitalization at approximately EUR 2.44 trillion equivalent, versus gold’s tokenized market cap of EUR 1.618bn (a PAX Gold proxy figure that reflects only the tokenized fraction, not the full gold market; see Appendix). Gold’s market cap rank of 54 within the tracked universe reflects this tokenization artifact, not gold’s true size.
Scenario framing (assumption): in a risk-off rotation, gold’s central-bank-anchored floor favors it over crypto benchmarks, which lack an official bid. In a liquidity-driven rally, crypto beta would likely exceed gold’s. If reserve diversification were to extend beyond gold into digital assets, the gap would narrow, but no dataset evidence supports that currently.
Scenario Framework
All scenarios are assumptions, not forecasts or stated central bank plans.
| Scenario | Triggers | XAU-EUR implication |
|---|---|---|
| Base (assumption) | Policy rates held at current levels (Fed 3.75% to 4.00%, ECB 2.50%); real yields range-bound; central bank accumulation persists near the ~1,000t annual pace [T2] [T4]. | Consolidation between the official-sector floor and the yield cap. Range roughly consistent with the recent 30-day tape of -2.58%. |
| Bull (assumption) | One of three triggers per Crux Investor (undated): a dovish pivot before inflation is fully controlled, inflation moderation without aggressive hikes, or real yield decline from economic weakness. None was priced as the futures base case at that source’s writing [T6]. | Opportunity cost falls, capital rotates back into gold; a recovery toward the EUR 4,688 ATH requires +29.22% from current levels. |
| Bear (assumption) | Oil-driven inflation persists and tightening extends across major central banks; real yields rise rapidly as in the UBS-cited pressure mechanism [T6] [T8]. | Deeper correction beyond the current -22.61% drawdown from ATH. |
| Tail (assumption) | Sovereign reserve liquidation: US ~8,133t, Germany ~3,350t, Italy ~2,451t official reserves as of December 2025 (per T6); forced sales would break the structural floor [T6]. | Supply shock undermines the central-bank floor thesis; historically rare but high impact. |
Currency overlay: EUR/USD at 1.1156 (-5.06% YTD) is the translation variable. A further EUR depreciation mechanically lifts EUR-quoted gold even with flat USD gold; an EUR rebound does the reverse. Illustration: the -0.53% five-day EUR/USD move against a -1.47% seven-day XAU-EUR move shows the FX channel offsetting part of the underlying pressure.
Valuation Discussion
Gold has no cash flows, so valuation must be framed through position in range, opportunity cost, and demand structure rather than multiples.
Position in range: At EUR 3,628.20, XAU-EUR sits 22.61% below its January 2026 peak and 186.75% above its 2019 low. The one-year return of +1.72% against a 200-day change of -14.48% shows the correction is concentrated in the recent months, coinciding with the September 2026 hiking sequence by the Fed and ECB. This is consolidation within a structurally higher range, not a regime break.
Opportunity cost: The ECB deposit rate of 2.50% and the Fed range of 3.75% to 4.00% imply an elevated carry disadvantage. The euro area AAA 10Y at 3.37% is the relevant EUR discount rate. A EUR real yield cannot be computed because no HICP print is in the dataset; this gap is flagged explicitly rather than filled with an assumption.
Demand structure: The 1,000t four-year official accumulation average versus 500t in the prior decade represents a doubling of the structural demand base [T2] [T4]. As an illustration only, 1,000t at the current EUR-quoted price implies roughly EUR 3.6 trillion of annual official demand at current price levels; this is a magnitude illustration, not a flow estimate.
Valuation verdict: Neither cheap nor expensive with conviction. The only available house view is UBS’s medium-term higher price expectation (undated) [T8]; Societe Generale cautions that a sharp monetary policy reversal driving real yields higher is the key headwind (undated) [T1]. Scenario-derived framing (assumption): if the AAA 10Y stays near 3.37% and inflation moderates, EUR real yields drift lower and a gradual re-rating toward the ATH region is plausible; if the September hiking sequence extends, the fair-value band compresses and a retest of recent lows becomes plausible. These are scenario ranges, not model outputs.
Risks
- Extended tightening: With the Fed at 3.75% to 4.00% and the ECB at 2.50% after September 2026 hikes, further hikes would raise gold’s opportunity cost. A hawkish surprise at the next decision is the primary near-term downside trigger [T6].
- Rapid real yield rise: Societe Generale flags a sharp monetary policy reversal pushing real yields higher as the main headwind to the structural support case (undated) [T1].
- Sovereign reserve liquidation (tail): US ~8,133t, Germany ~3,350t, Italy ~2,451t of official reserves as of December 2025 (per T6). Forced sales to stabilize public finances would create a supply shock and weaken the structural floor [T6].
- FX risk: An EUR/USD recovery from 1.1156 (YTD -5.06%) would compress EUR-quoted gold independently of USD gold dynamics.
- Demand concentration: The bull case leans heavily on continued EMDE central bank buying. Survey sentiment (89% expecting reserve growth [T4]) is a stated intention, not committed flow.
- Data gaps: No current CPI/HICP prints, no BoE or BoJ policy rates, no ETF flow data, and no publication timestamps for several sources (T1, T2, T6, T8) are available in the dataset. Conclusions resting on these inputs carry elevated uncertainty.
- Two-sided note: The same neutral risk sentiment that limits gold’s safe-haven premium also limits the equity drawdown scenario that would revive it. Gold’s near-term path depends more on yields and flows than on risk sentiment.
Appendix
Methodology and provenance: Price data derives from the bundle market_data block, retrieved 2026-10-29T05:21:50Z. XAU-EUR is priced via the PAX Gold token proxy (coingecko_id: pax-gold), which can trade at a premium or discount to London or COMEX spot; the market cap of EUR 1.618bn reflects only the tokenized fraction (circulating supply 446,125.618 tokens) and not the full gold market. Policy rates come from the bundle policy_rates block (FRED for the Fed, ECB key rate for the ECB), as of 2026-10-28 and 2026-10-29 respectively. Yield curve data comes from the ECB AAA euro-area yield curve as of 2026-10-27; FX data from Frankfurter (ECB reference rates) as of 2026-10-29.
Source dating caveats: T3 was published in September 2025. T1, T2, T4, T6, T7, and T8 lack publication timestamps in the dataset and are cited without implying recency. T6 in particular references mid-2026 scenarios and futures positioning that may be stale relative to the 2026-10-29 report date; its claims are presented as dated-source views, not current market state. T2 notes the WGC survey was fielded between Feb 5 and May 19, 2026 with 76 respondents, the highest participation in the survey’s nine-year history.
Data not in the dataset: Bank of England and Bank of Japan policy rates, current CPI/HICP/PCE inflation prints, realized real yields, ETF flow data, and Bitcoin and Ethereum price and return series are unavailable and are explicitly not stated.
Sources
- [T1] Gold’s Dual Drivers: Central Bank Flows and Real Yields, According to Societe Generale, CryptoRank.io. Link
- [T2] Central Bank Gold Purchases Hit 1,000t Average: WGC Survey, Mexico Business News. Link
- [T3] Central banks are turning back to gold, OMFIF, September 2025. Link
- [T4] Central Bank Gold Reserves Survey 2026, World Gold Council. Link
- [T5] Central Bank Gold Reserves Survey (archive), World Gold Council. Link
- [T6] Gold Declined 10% Over Two Weeks on Rising Oil Prices and Interest Rate Pressure, Crux Investor. Link
- [T7] What Affects Gold Prices? 6 Key Factors Explained, XTB. Link
- [T8] Gold: Between inflation fears and diversification of reserves, UBS. Link
Disclaimer: This report is AI-generated, for informational purposes only, and does not constitute investment advice, a recommendation, or an offer to buy or sell any security or asset. Data may be incomplete, delayed, or derived from proxies. Readers should conduct their own analysis and consult a licensed advisor before making investment decisions.
Important Note / Wichtiger Hinweis:
EN: This report may have been generated using AI. It processes data from publicly available sources. The content is provided for informational purposes only.DE: Dieser Bericht kann mithilfe von KI erstellt worden sein. Dabei werden Daten aus öffentlich zugänglichen Quellen verarbeitet. Die Inhalte dienen ausschließlich Informationszwecken.
* DE: Die ergänzenden Inhalte können KI-generiert sein. EN: The additional content may be AI-generated.