
The altii-BTC-Report: Bitcoin in a Post-Hike Liquidity Regime
Date: 30 October 2026 | Asset: Bitcoin (BTC) | Quote currency: EUR | Profile: Institutional
Watch the video
This player shows only the Bitcoin chapter of the daily altii market briefing. Watch the full video on tube.altii.de.
Key Data Snapshot
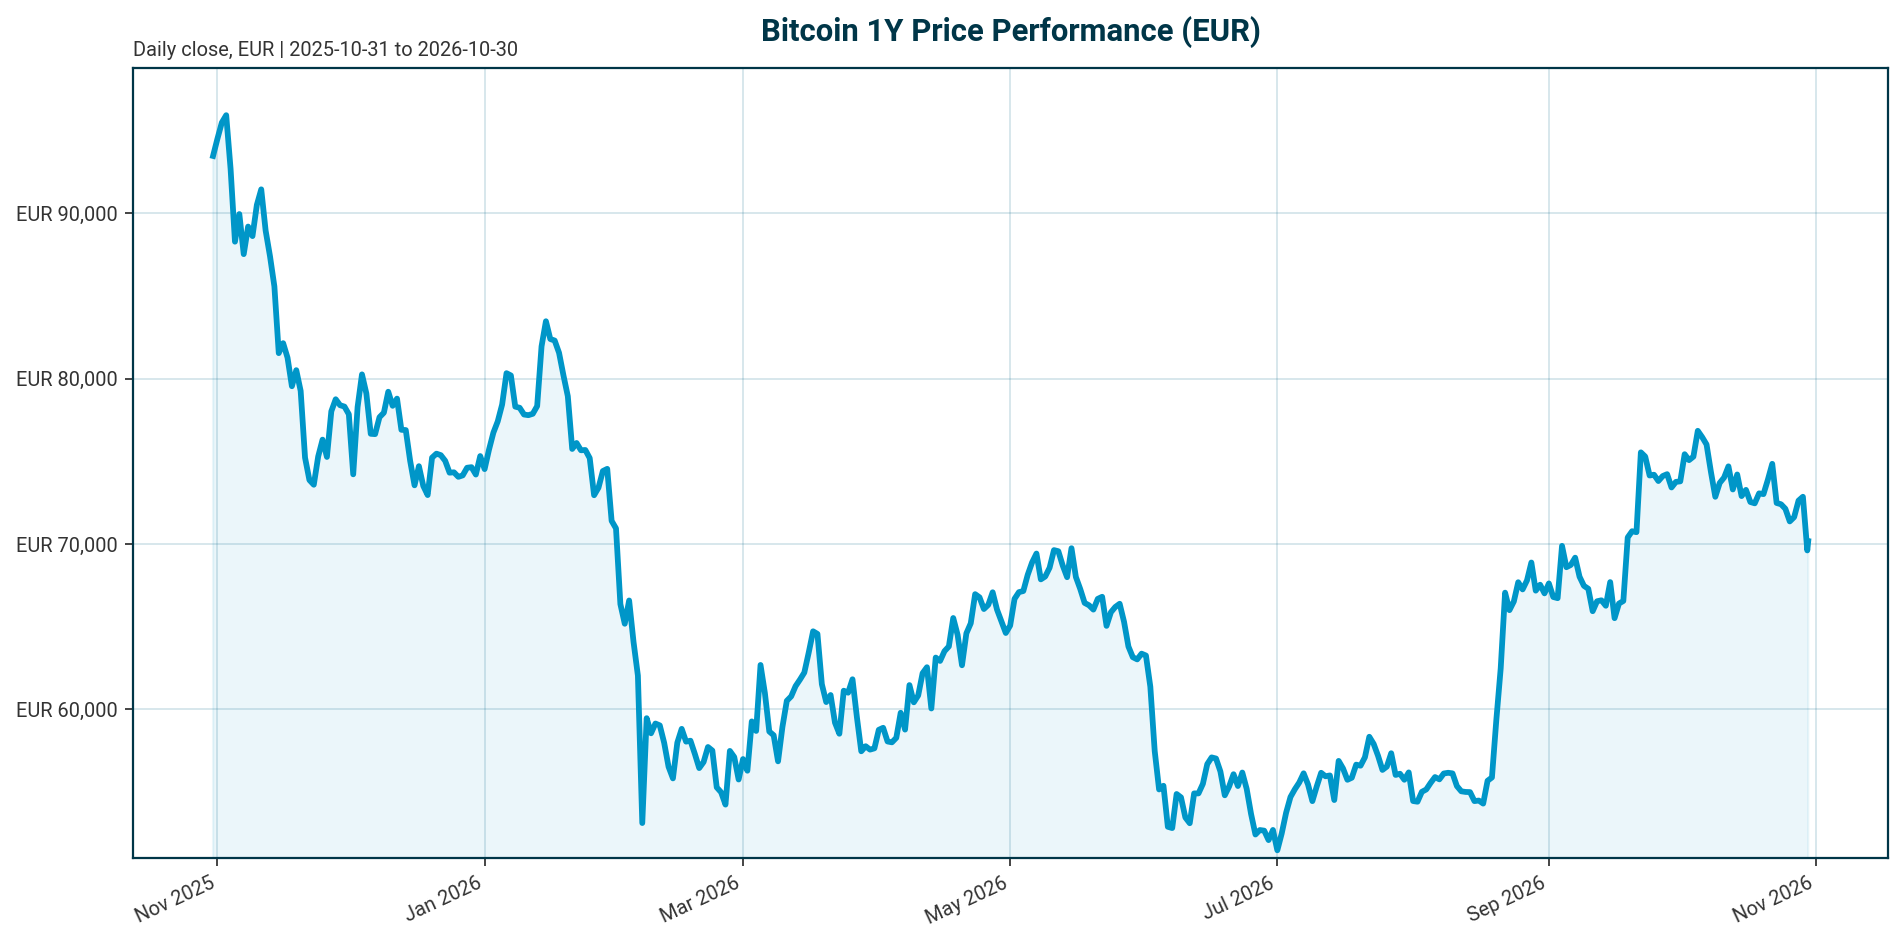
| Metric | Value |
|---|---|
| Price (EUR) | EUR 70,175 |
| 24h range | EUR 68,345 to EUR 73,171 |
| 24h change | -2.72% |
| 7d / 14d / 30d change | -4.43% / -4.70% / -6.13% |
| 200d / 1y change | +10.10% / -29.38% |
| 24h volume | EUR 46.05bn |
| Market cap | EUR 1.41tn (rank 1) |
| Fully diluted valuation | EUR 1.41tn |
| BTC dominance | 59.35% |
| Total crypto market cap | EUR 2.37tn |
| Circulating / max supply | 20,105,365 / 21,000,000 (95.74% issued) |
| All-time high | EUR 107,662 (6 Oct 2025); current price -34.82% below |
| Fed funds target range | 3.75% to 4.00% (as of 2026-10-29); last change: +25 bp hike effective 2026-09-17 |
| ECB deposit facility rate | 2.50% (as of 2026-10-30); last change: +25 bp hike effective 2026-09-16 |
| Euro area AAA 10Y yield | 3.39% (+0.8 bp over 5 days) |
| EUR/USD | 1.1162 (-0.45% over 5 days, -5.00% YTD) |
Source: bundle market data retrieved 2026-10-30T05:15:06Z; policy rates from the authoritative Policy Rates block.
Market Setup
The cross-asset backdrop is neutral in risk sentiment but moderately negative in equity momentum, with DACH indices outperforming global peers. The DAX has the strongest 5-day move at 3.41% and leads on a 1-month basis at 2.52%, while DACH indicators average 3.39% over 5 days versus 1.11% for global equity indicators. The Nasdaq Composite is down 2.29% and the Nikkei 225 down 5.19% over one month, so the equity tape offers bitcoin no tailwind. Euro-area yields are mixed: the AAA 10Y yield sits at 3.39%, up 0.8 bp over 5 days but down 23.9 bp over the month, and the AAA 2Y yield is up 95.13 bp year to date at 3.06%, a clear 2026 repricing higher in short-dated euro rates. FX is mixed, with EUR/USD at 1.1162, down 0.45% over 5 days.
The policy environment is the dominant headwind. The Fed funds target range stands at 3.75% to 4.00% after a 25 bp hike effective 2026-09-17, and the ECB deposit facility rate is 2.50% after a 25 bp hike effective 2026-09-16. Both major central banks tightened in September 2026, so a tighter-for-longer liquidity regime is the base case for risk assets including bitcoin. Any easing pivot would be an upside surprise scenario, not a current decision. Within digital assets, bitcoin remains the core allocation at 59.35% dominance of a EUR 2.37tn total market cap.
Investment Thesis
Bitcoin at EUR 70,175 is in a corrective regime within a longer-term uptrend: negative across the 24h, 7d, 14d and 30d windows and down 29.38% year on year, yet still up 10.10% over 200 days. The core institutional thesis is that bitcoin is a macro-sensitive, supply-constrained asset whose near-term direction is governed by two variables: the policy rate path and ETF flows, with US regulatory passage as the primary medium-term catalyst.
The macro backdrop is the primary variable. According to the Q2 2026 Digital Asset Review [T1] from July 2026, the Fed under Chair Kevin Warsh was then expected to hold rates through Q3, leaving limited room for the policy easing that has historically supported risk-asset recoveries. That expectation was overtaken by events: the September 2026 hike moved the target range to 3.75% to 4.00%. Institutional adoption has deepened liquidity and supported regulated price discovery, but it has also tied bitcoin more closely to traditional macro and credit cycles than during the retail-driven era [T2]. This raises the asset’s sensitivity to the rate path in both directions.
ETF flows are the most tangible leading indicator of whether institutional capital rotation back into digital assets has begun [T1]. According to T4 (undated in the feed), a strong week of USD 3.55bn in crypto fund inflows, led by bitcoin, restored cumulative 2026 bitcoin ETF flows to positive after early-year withdrawals, with lower prices cited as creating more attractive entry points. Structurally, Morgan Stanley and Vanguard added bitcoin products to their platforms in Q4 2025, per ARK research from February 2026 [T3], and ETFs increasingly function as a bridge between bitcoin and traditional capital pools. ARK also cited, in that February 2026 article, more than USD 10tn in lower-yielding money-market and fixed-income ETFs as potential rotation capital; we treat this as dated scenario capacity, not current flow.
Base case (scenario): bitcoin consolidates in a range while the Fed holds at 3.75% to 4.00% and CLARITY Act progress remains uncertain, with ETF flows the marginal price driver. Bull scenario (assumption): regulatory passage plus a policy easing pivot triggers institutional rotation. Bear scenario (assumption): further tightening or a regulatory setback repeats the prior outflow-and-drawdown pattern [T4].
Bullish Drivers
- Regulatory catalyst: The US CLARITY Act would establish a federal market-structure framework for digital assets and could unlock broader institutional participation if passed [T1].
- Platform expansion: Morgan Stanley expanded client access to regulated bitcoin products including spot ETFs, and Vanguard added third-party bitcoin ETFs after years of excluding crypto and all commodities (per ARK, February 2026) [T3].
- Flow recovery: Crypto funds saw USD 3.55bn of inflows in a strong week, restoring 2026 bitcoin ETF flows to cumulative positive territory (per T4, undated in the feed).
- Structured product depth: Deep, liquid options markets on regulated bitcoin ETFs now support covered call, buffered and other derivatives-based income strategies [T1], broadening the addressable investor base.
- Sovereign and state adoption: Discussions on adding bitcoin to government reserves, treatment of seized federal holdings, and state-level adoption with Texas buying bitcoin for its reserves (per ARK, February 2026) [T3].
- Slow but steady institutional widening: Pension participation is expanding, and sovereign wealth funds and central banks have appeared as ETF holders in 13F filings, though disclosed positions remain modest [T2].
Scenario assumption: if the CLARITY Act passes, institutional participation broadens beyond the current ETF issuer set, supporting a re-rating toward the all-time high region. Scenario assumption: a sustained multi-week positive flow streak would provide stronger confirmation of institutional demand recovery than a single strong week [T4].
Relative Positioning vs Gold and Ethereum
The bundle contains no gold or ethereum price data, so the comparison against bitcoin’s two benchmark assets is necessarily qualitative and flow based; gold and ethereum price levels are unavailable in the dataset.
Versus gold: Bitcoin’s fixed 21 million supply cap, with 95.74% already issued, is the standard scarcity argument against gold’s supply elasticity. In a risk-on easing cycle, bitcoin’s higher beta would likely outperform gold; in the current risk-off tightening regime, gold’s lower volatility would likely dominate. Without gold price data in the bundle, this relative-performance claim cannot be quantified here.
Versus ethereum: Ethereum funds attracted USD 702 million in the same week that bitcoin flows turned positive (per T4, undated in the feed), indicating broadening institutional demand across crypto assets rather than a bitcoin-only rotation. Ethereum’s tokenization and stablecoin narrative competes for institutional capital, particularly in Asia, where pure bitcoin ETFs play a smaller strategic role than in North America and Europe and where tokenization and regulated stablecoin frameworks such as Hong Kong’s Stablecoins Ordinance act as entry points [T1]. Bitcoin’s dominance of 59.35% nonetheless supports its role as the core crypto allocation for institutions seeking the most liquid, deepest-market exposure.
Scenario Framework
| Scenario | Triggers | Implication for BTC/EUR |
|---|---|---|
| Bull | CLARITY Act passes and/or the Fed pivots to easing from the 3.75% to 4.00% range; ETF inflows accelerate | Material recovery toward the EUR 90,000 to EUR 107,662 region (scenario assumption, anchored to the regulatory-catalyst thesis in T1 and T3) |
| Base | Fed holds at 3.75% to 4.00%; CLARITY Act stalls; flows stay choppy | Range roughly EUR 65,000 to EUR 78,000 with flow-dependent volatility (scenario assumption, consistent with the hold expectation in T1 from July 2026) |
| Bear | Further Fed or ECB hikes, or adverse US regulatory developments, trigger renewed outflows as in the prior USD 450M outflow episode (per T4, undated in the feed) | Break below the EUR 68,345 24h low toward deeper drawdown territory (scenario assumption) |
All price bands are scenario assumptions, not forecasts. The current price of EUR 70,175 sits 34.82% below the EUR 107,662 all-time high, so the bull case requires a recovery of roughly 53.4% (107,662 / 70,175 – 1). Because institutional adoption has tied bitcoin more closely to macro and credit cycles [T2], rate-path sensitivity is elevated in every scenario.
Valuation Discussion
Bitcoin has no cash flows, so traditional discounted valuation methods do not apply. The relevant valuation anchors are supply structure, market cap ratios, and flow dynamics.
- Supply and FDV: Circulating supply of 20,105,365 against a 21,000,000 max means 95.74% of all bitcoin that will ever exist is already issued. Market cap equals fully diluted valuation at EUR 1.41tn, so future sell-side supply pressure comes only from the remaining 4.26% plus holder distribution, not from uncapped issuance.
- Drawdown position: At EUR 70,175, the price is 34.82% below the October 2025 all-time high of EUR 107,662. The market has already retraced a third from peak, which institutional commentary cites as creating more attractive entry points than previous highs (per T4, undated in the feed).
- Liquidity quality: 24h volume of EUR 46.05bn against a EUR 1.41tn market cap implies daily turnover of about 3.27% (46,053,065,042 / 1,410,652,420,524), consistent with an institutional-grade liquidity profile.
- Rotation capacity: ARK cited in February 2026 more than USD 10tn in lower-yielding money-market and fixed-income ETFs as potential rotation capital [T3]. If even a small fraction rotated, the market cap could re-rate toward prior peak levels. This is capacity framing, not a forecast.
Scenario assumption: with supply issuance nearly complete, incremental demand must transact at higher marginal prices, making flow shocks asymmetrically impactful in both directions. Note also that EUR/USD is down 5.00% year to date at 1.1162, so EUR-quoted performance differs from USD-quoted performance; the bundle contains no USD-quoted BTC price, so that differential is flagged but not computed.
Risks
- Policy rate path: Both the Fed (25 bp hike effective 2026-09-17, target range now 3.75% to 4.00%) and the ECB (25 bp hike effective 2026-09-16, deposit rate now 2.50%) tightened in September 2026. Scenario assumption: an additional Fed hike would pressure risk assets disproportionately given bitcoin’s tightened macro linkage [T2].
- Regulatory failure or adverse change: Regulatory uncertainty remains a major risk; unexpected restrictions on ETFs, custody, taxation or trading could cause temporary outflows [T4]. A failed CLARITY Act vote could repeat the prior outflow-and-drawdown pattern, which previously coincided with BTC falling below USD 76k and USD 450M of ETF outflows (per T4, undated in the feed).
- Custody and operational risk: Custody remains an operational risk even with qualified custodians; hacks and internal exploits could put funds at risk [T2].
- Issuer concentration: ETF assets are concentrated in a handful of issuers, raising market-structure questions if any issuer experiences operational stress [T2].
- Volatility and redemption spirals: Institutional adoption has not made bitcoin less volatile [T2]. Large price swings can trigger redemptions from crypto products and weaken ETF inflows [T4], and treasury-leveraged equity strategies have shown amplified drawdowns relative to the underlying token [T2].
- FX translation: For EUR-quoted investors, EUR/USD at 1.1162, down 5.00% year to date, creates translation effects between EUR- and USD-quoted performance.
Appendix
Methodology and Data Provenance
All price and market data come from CoinGecko via the report bundle, retrieved 2026-10-30T05:15:06Z, quoted in EUR. Policy rates come from the authoritative Policy Rates block (FRED for the Fed, ECB key rate for the ECB), as of 2026-10-29 and 2026-10-30 respectively. Macro data points cover DAX, ATX, Euro Stoxx 50, S&P 500, Nasdaq, Nikkei 225, Hang Seng, the ECB AAA yield curve and EUR crosses.
Source Dating Caveats
T1 is a Q2 2026 review dated July 2026; its expectation that the Fed holds rates through Q3 was overtaken by the September 2026 hike and is presented as dated context only. T3 is dated February 2026 and describes a Fed rate-cutting cycle in early innings, which conflicts with the September 2026 hikes; it is likewise dated context. T2 and T4 are undated in the feed, so all figures from them are attributed as undated and never presented as current state. T5 and T6 were excluded as low-quality sources. The bundle contains no gold or ethereum price data and no on-chain metrics (hashrate, active addresses, exchange balances), so benchmark and valuation comparisons are limited to market-cap and flow-based framing. A minor discrepancy exists between the reported BTC dominance of 59.35% and the computed share of total crypto market cap of about 59.51% (1,410,652,420,524 / 2,370,474,443,411.72), likely due to retrieval timing. News figures denominated in USD are kept in their original currency and not converted, as no FX rate at the source date is available.
Glossary
- ETF: Exchange-traded fund; the regulated wrapper through which most institutional bitcoin exposure is currently accessed.
- DAT: Digital asset treasury company; an equity vehicle holding bitcoin on its balance sheet.
- CLARITY Act: Proposed US legislation to establish a federal market-structure framework for digital assets [T1].
- Dominance: Bitcoin’s share of total crypto market cap, here 59.35%.
- FDV: Fully diluted valuation; price multiplied by maximum supply. Equals market cap here because supply issuance is 95.74% complete.
Sources
- [T1] Q2 2026 Digital Asset Review. https://www.coindesk.com/coindesk-indices/2026/07/09/q2-2026-digital-asset-review
- [T2] Institutional Bitcoin Adoption Explained: How Blackrock, Fidelity and Others Embraced BTC. https://www.theblock.co/learn/macro/institutional-bitcoin-adoption-explained-how-blackrock-fidelity-and-others-embraced-btc-407111
- [T3] Bitcoin’s Evolving Institutional Role. https://www.ark-invest.com/articles/analyst-research/bitcoins-evolving-institutional-role
- [T4] Crypto Funds See $3.55B Inflows: Bitcoin Leads as Ethereum and Solana Surge. https://bitcoinfoundation.org/news/etfs/crypto-funds-see-3-55b-inflows-bitcoin-leads-as-ethereum-and-solana-surge
Disclaimer
This report is AI-generated and provided for informational purposes only. It does not constitute investment advice, a recommendation, or an offer to buy or sell any financial instrument. Scenario levels and forward-looking statements are assumptions, not forecasts. Readers should conduct their own due diligence and consult a licensed advisor before making investment decisions.
Important Note / Wichtiger Hinweis:
EN: This report may have been generated using AI. It processes data from publicly available sources. The content is provided for informational purposes only.DE: Dieser Bericht kann mithilfe von KI erstellt worden sein. Dabei werden Daten aus öffentlich zugänglichen Quellen verarbeitet. Die Inhalte dienen ausschließlich Informationszwecken.
* DE: Die ergänzenden Inhalte können KI-generiert sein. EN: The additional content may be AI-generated.