
Watch the video
This player shows only the Gold chapter of the daily altii market briefing. Watch the full video on tube.altii.de.
Key Data Snapshot
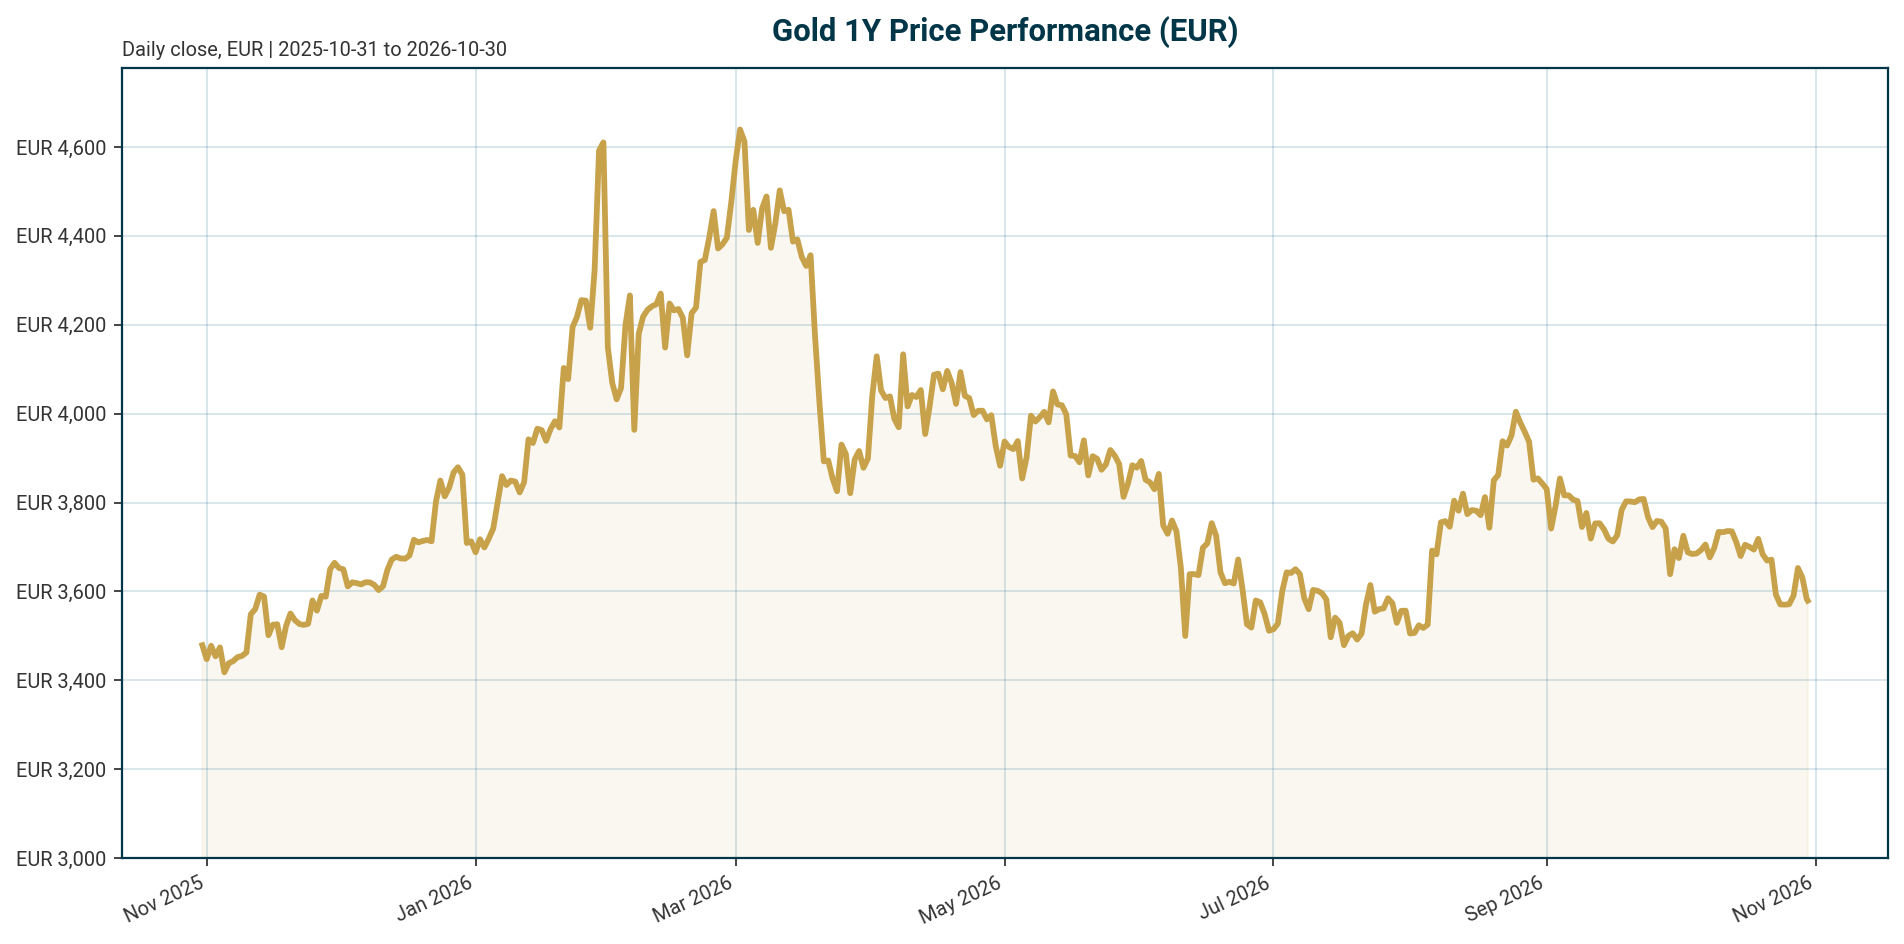
Gold (XAU), quoted in EUR, trades at EUR 3,577.71 as of 30 October 2026 (data retrieved 05:18 UTC). The metal is in a corrective phase: it sits 23.69% below its all-time high of EUR 4,688.32 from 28 January 2026, yet remains 1.51% higher year-on-year and 182.76% above its 2019 low of EUR 1,265.28.
| Metric | Value | As of / Note |
|---|---|---|
| XAU/EUR price | EUR 3,577.71 | 24h range EUR 3,568.72 to 3,609.85 |
| Performance | -1.38% (24h), -0.71% (7d), -4.37% (30d), -14.89% (200d), +1.51% (1y) | Retrieved 2026-10-30 |
| All-time high | EUR 4,688.32 (-23.69% from ATH) | 2026-01-28 |
| Fed funds target range | 3.75% to 4.00% | Last change: +25 bp hike, effective 2026-09-17 (as of 2026-10-29) |
| ECB deposit facility rate | 2.50% | Last change: +25 bp hike, effective 2026-09-16 (as of 2026-10-30) |
| Euro area AAA 10Y yield | 3.39% (+44.5 bp YTD, -23.9 bp over 1 month) | ECB yield curve, 2026-10-28 |
| Euro area AAA 2Y / 30Y | 3.06% / 3.61% | 10Y-2Y spread: 33.3 bp |
| EUR/USD | 1.1162 (-0.45% over 5 days, -5.00% YTD) | 2026-10-30 |
| Tokenized instrument market cap | EUR 1.596bn (446,121.05 oz supply) | PAXG proxy, rank 54; not the physical gold market size |
Recovery required to reclaim the ATH: 4,688.32 / 3,577.71 – 1 = approximately +31.0%. For cross-currency context, indicative EUR equivalents at EUR/USD 1.1162: USD 4,000/oz converts to roughly EUR 3,584, USD 3,942 (the summer low cited in [T7]) to roughly EUR 3,532, and USD 4,900 (the Goldman Sachs target in [T6]) to roughly EUR 4,390. These conversions are indicative only.
Macro Backdrop
Market overview: Risk sentiment is neutral with moderately negative equity momentum, while DACH equities are outperforming global peers: DAX indicators average 3.39% over five days versus 1.11% for global equity benchmarks, and the DAX posts the strongest five-day move at 3.41%. The rates backdrop shows mixed euro yields, with the euro area AAA 10Y yield at 3.39%, up just 0.8 bp over five days but down 23.9 bp over the past month, and a 10Y-2Y spread of 33.3 bp. FX is mixed, with EUR/USD at 1.1162, down 0.45% over five days. These conditions matter for gold mainly through the euro-area opportunity-cost channel and the EUR translation effect.
Policy is the dominant variable. The Federal Reserve’s target range stands at 3.75% to 4.00% following a 25 bp hike effective 17 September 2026, its first increase under Chair Kevin Warsh after holding at 3.50% to 3.75% since the start of the year, according to [T7], a Q4 2026 outlook. The ECB deposit facility rate stands at 2.50% after a 25 bp hike effective 16 September 2026; Bundesbank President Nagel defended the ECB’s 25 bp hikes in June and September, according to [T2]. PCE inflation ran around 3.7% in July, and markets pushed the 10-year Treasury yield above 5.2%, the 30-year above 5.5% and the 10-year real yield to around 1.6%, according to [T7]. These US yield figures are source-derived, not bundle-verified; no live US Treasury or real-yield data is in the dataset.
The inflation wildcard cuts both ways. Oil rose from roughly USD 70 before the summer to above USD 100 following the US-Iran conflict, according to [T2]. Higher oil keeps the inflation-hedge narrative for gold alive, but it also risks keeping central banks restrictive for longer, sustaining the opportunity cost of holding a non-yielding asset, as [T5] from October 2026 argues. For a EUR-based investor, the euro-area AAA 10Y yield at 3.39% is the relevant domestic opportunity-cost benchmark; a EUR real-yield proxy cannot be computed because euro-area HICP is not in the dataset.
Investment Thesis
Gold is caught between two powerful forces. On one side, restrictive monetary policy: both the Fed (3.75% to 4.00%) and the ECB (2.50% deposit rate) hiked in September 2026, real yields are elevated at around 1.6% on the US 10-year according to [T7], and this historically pressures non-yielding gold. On the other side, a structural official-sector bid: central banks accumulated an average of 1,000 tonnes of gold over the past four years, double the 500-tonne average of the preceding decade, according to the WGC 2026 survey [T3], [T4].
The key analytical point is that the old pricing model is breaking down. SocGen describes a post-2022 regime shift in which gold trades near record highs despite positive real yields, with central bank purchases, dedollarisation, geopolitical uncertainty and sovereign debt concerns providing a higher price floor, according to [T1] from September 2026. LBMA conference participants similarly noted that gold’s traditional negative correlation with bond yields is systematically weakening; gold held above USD 4,000/oz even with US 10-year yields above 5%, according to [T2]. Bundesbank President Nagel disclosed that gold’s share of global central bank reserves has risen from roughly 14% in 2023 to nearly 25%, according to [T2].
Demand breadth supports the floor thesis. The ECB’s June 2026 report shows central bank purchases eased to around 850 tonnes in 2025 from over 1,000 tonnes annually in 2022 to 2024, but remained well above historical norms, while private investment demand reached nearly 2,200 tonnes in 2025, almost double the 2024 figure, fuelled by a record USD 89 billion in ETF inflows, according to [T8]. Since 2022, China has bought over 350 tonnes, Poland 320 tonnes, Türkiye 220 tonnes and India 130 tonnes; Poland was the largest official purchaser in 2025 at around 100 tonnes [T8].
Base case (scenario assumption): gold consolidates in an elevated range as official demand offsets real-yield headwinds, with dips attracting longer-term buyers across physical, ETF and futures markets, per [T5] from October 2026. The bearish counterpoint deserves equal weight: official demand cannot prevent further declines, and the near-term forecast remains uncertain until gold prints a meaningful higher high [T5].
Bullish Drivers
- Structural official demand. Central banks bought an average 1,000t per year over four years versus 500t in the prior decade [T3]. A record 89% of surveyed reserve managers expect global central bank gold reserves to rise over the next 12 months, and a record 45% expect their own reserves to increase [T4].
- Geopolitical hedging is now mainstream. In the WGC survey of 76 central banks, the highest participation in nine years, 92% cited interest rate levels and 90% cited gold’s crisis performance as key allocation drivers; 95% of EMDE institutions view geopolitical instability as a key driver versus 67% of advanced economies [T3]. The survey ran from 5 February to 19 May 2026, capturing sentiment after the Middle East escalation.
- Operational repositioning. The Dutch central bank moved roughly 86 tonnes from the US and Canada to London between March and August 2026 as crisis preparedness, cutting the US share of Dutch gold from 31.3% to 18.5%, according to [T2]. Repatriation and re-vaulting signal intent to hold, not trade.
- Real-yield mean reversion potential. Persistently high real rates suggest potential for easing that could fuel continuation of the bull market; the most favorable scenario is a sharp US slowdown leading to policy easing, according to [T6]. Goldman Sachs maintains a target close to USD 4,900/oz, roughly EUR 4,390 at current EUR/USD, per [T6].
- Stable private demand. ETF inflows moderated sharply in 2026 but remain positive, and lower volatility is improving gold’s appeal to longer-term reserve managers, according to [T1] from September 2026.
Relative Positioning vs Bitcoin and Ethereum
The bundle provides no current Bitcoin or Ethereum price data, so specific ETH and BTC return comparisons are unavailable. What the data does show: total crypto market capitalisation stands at USD 2.37 trillion with Bitcoin dominance at 59.35%, and the tokenized gold instrument (PAXG) ranks 54 by market cap at EUR 1.596bn, underscoring the scale difference between tokenized gold and the broader crypto complex.
Positioning by role: gold’s 2026 profile in EUR, +1.51% over one year but -14.89% over 200 days, illustrates two-way risk even for the classic hedge. Its advantage over crypto in a restrictive-for-longer regime is the official-sector bid: central bank purchases of roughly 850t in 2025 [T8] have no analogue in crypto, where demand is entirely private. Gold’s falling volatility is improving its appeal to long-term reserve managers [T1], contrasting with crypto’s structurally higher volatility profile.
There is one direct crypto-gold linkage worth noting: Tether, the largest stablecoin issuer, was a larger gold purchaser than Poland in 2025, according to the ECB report [T8]. Scenario framing (assumptions): in a risk-off environment with falling rates, both gold and crypto should benefit, but gold’s official bid implies shallower drawdowns; in a restrictive-for-longer regime, both non-yielding assets face opportunity-cost pressure, but crypto’s higher beta implies larger losses.
Scenario Framework
| Scenario | Macro conditions | Implication for XAU/EUR |
|---|---|---|
| Bull | US growth slows, Fed pauses or eases from 3.75% to 4.00%; real yields fall from around 1.6%; dollar weakens (assumption, per [T6], [T7]) | Return toward or above prior highs. Goldman Sachs target near USD 4,900/oz, roughly EUR 4,390 at EUR/USD 1.1162 [T6]. Major banks expect previous highs or above in the medium term [T6]. |
| Base | Policy stays restrictive with sticky inflation; oil above USD 100 keeps both inflation and yields elevated; EUR/USD near 1.1162 (assumption, per [T5], [T7]) | Consolidation in an elevated range. Official buying floors dips; EUR/USD becomes the swing factor for EUR-quoted returns. Current EUR 3,577.71 sits near the USD 4,000/oz psychological level (roughly EUR 3,584 converted). |
| Bear | Growth stays buoyant while inflation accelerates, solidifying the Fed hiking cycle (assumption, per [T6]) | A break below the USD 3,942 summer low (roughly EUR 3,532) could push gold toward USD 3,500, roughly EUR 3,136 at current EUR/USD, per [T7]. That implies roughly 12.3% downside from EUR 3,577.71. |
Calculation note: the bear-case EUR target derives from USD 3,500 / 1.1162 = EUR 3,135.7, a decline of (3,135.7 / 3,577.71) – 1 = -12.3%. The bull-case EUR target derives from USD 4,900 / 1.1162 = EUR 4,390.1, upside of approximately +22.7%. Both conversions assume an unchanged exchange rate and are indicative.
Valuation Discussion
Is gold cheap or expensive? The answer depends on which pricing regime you believe. In EUR terms, XAU at 3,577.71 is 23.69% below its January 2026 ATH of EUR 4,688.32 and 182.76% above its 2019 low. On a traditional real-yield model, gold looks expensive: with the US 10-year real yield around 1.6% according to [T7] and both the Fed and ECB in tightening mode, historical models would imply significantly lower prices, as SocGen itself concedes [T1].
The regime-shift argument flips that conclusion. SocGen argues structural factors, sustained central bank purchases, dedollarisation, geopolitical uncertainty and sovereign debt concerns, provide a higher floor that limits the downside impact of elevated real rates [T1]. LBMA participants describe gold’s pricing logic as re-anchoring, with the yield correlation systematically weakening [T2]. If that thesis holds, the current EUR price represents a mid-cycle dip within a structural bull market rather than a valuation peak.
Demand-side valuation adds nuance. Private investment demand of nearly 2,200t in 2025, nearly 50% of global demand, with record USD 89bn ETF inflows [T8], may have plateaued after a historically high 2025, according to [T6]. If so, falling real yields would not automatically translate into higher prices. Conversely, official purchases of around 850t in 2025 [T8], even at a reduced pace, provide a demand floor that did not exist in prior cycles. If real-yield models reassert themselves, gold could prove expensive relative to fundamentals, with downside toward the USD 3,500 area flagged by [T7].
Caveat: the headline EUR price reflects a tokenized gold instrument (PAXG, 446,121 oz circulating supply). Spot XAU/USD references in sources (USD 4,000+ levels) are USD-denominated and dated per each source; they are not live bundle data.
Risks
- Renewed Fed tightening (principal bearish risk). The most significant bearish risk is a macro scenario where US growth and employment remain buoyant but inflation continues to accelerate, solidifying a Fed hiking cycle, according to [T6]. Central banks could also keep rates high for longer or tighten further if inflationary pressures persist [T6].
- Plateauing investment demand. Investment demand reached a historically high level in 2025; a decline in real interest rates would therefore not necessarily guarantee an increase in demand [T6].
- Falling inflation expectations. A sharp inflation slowdown driven by a weakening economy could reduce inflation expectations while monetary policy stays unchanged, limiting the fall in real yields that bulls are counting on [T6].
- The oil trap. Higher oil keeps central banks hawkish, sustaining the opportunity cost of holding a non-yielding asset [T5], from October 2026. An oil spike from the US-Iran conflict simultaneously strengthens the inflation-hedge case and the hawkish-policy case, leaving gold torn between its two narratives [T2], [T5].
- Official demand is a floor, not a ceiling. Official buying cannot prevent further declines, even if it makes a prolonged bear market less convincing [T5]. Analysts caution that the debasement trade does not imply a one-way rally [T2].
- Upside risk to the bearish view. A dovish surprise from the Fed, or faster US growth deterioration than markets expect, would compress real yields quickly and could trigger a sharp re-rating higher, catching underweight positions off guard.
Appendix
Methodology and Data Provenance
Policy rates are sourced exclusively from the bundle’s Policy Rates block: US Federal Funds Target Range of 3.75% to 4.00% as of 2026-10-29, last change a 25 bp hike effective 2026-09-17; ECB Deposit Facility Rate of 2.50% as of 2026-10-30, last change a 25 bp hike effective 2026-09-16. No other central bank policy rate is in the dataset.
Market data was retrieved 2026-10-30T05:18:56Z. Euro-area yields are as of 2026-10-28 (ECB yield curve); FX data as of 2026-10-30 (Frankfurter); equity data as of 2026-10-29 or 2026-10-30. The headline price reflects a tokenized gold instrument (PAXG, coingecko_id pax-gold) with 446,121.05 oz circulating supply; its EUR 1.596bn market capitalisation is the token’s capitalisation, not the size of the physical gold market. Bitcoin and Ethereum price data are not in the bundle, so crypto return comparisons are qualitative only. Euro-area HICP, US CPI/PCE, US Treasury yields and DXY are not in the dataset; US rates context relies on Tavily sources and is flagged as source-derived.
Source dating: [T5] is dated October 28, 2026; [T1] was published September 3, 2026 (per URL); [T7] is a Q4 2026 outlook; [T3] and [T4] are the WGC 2026 survey with data collected February 5 to May 19, 2026; [T8] is the ECB’s June 2026 report describing 2025 flows and should be read as historical. [T2] and [T6] are undated in the dataset; their figures are attributed by source label only. USD-denominated price levels from sources (USD 3,942 support, USD 4,900 target, USD 4,000 to 4,500 range) are XAU/USD quotes and differ from the EUR-quoted headline price; EUR conversions use EUR/USD 1.1162 and are indicative.
Sources
- [T1] It’s time to get bullish on gold again, says SocGen | Kitco News
- [T2] Gold Holds Above $4,000 Even as US Treasury Yields Top 5% | BigGo Finance
- [T3] Central Bank Gold Purchases Hit 1,000t Average: WGC Survey
- [T4] Central Bank Gold Reserves Survey 2026 | World Gold Council
- [T5] Gold outlook: XAU/USD holds above key support ahead of FOMC
- [T6] Real Interest Rates at Record Highs: What If Gold Benefits Again? | GoldBroker
- [T7] Gold caught between central banks and the Fed
- [T8] The international role of the euro, June 2026 | ECB
Disclaimer
This report is AI-generated, for informational purposes only, and does not constitute investment advice. Figures should be verified against primary sources before any decision-making use. Past performance is not indicative of future results.
Important Note / Wichtiger Hinweis:
EN: This report may have been generated using AI. It processes data from publicly available sources. The content is provided for informational purposes only.DE: Dieser Bericht kann mithilfe von KI erstellt worden sein. Dabei werden Daten aus öffentlich zugänglichen Quellen verarbeitet. Die Inhalte dienen ausschließlich Informationszwecken.
* DE: Die ergänzenden Inhalte können KI-generiert sein. EN: The additional content may be AI-generated.